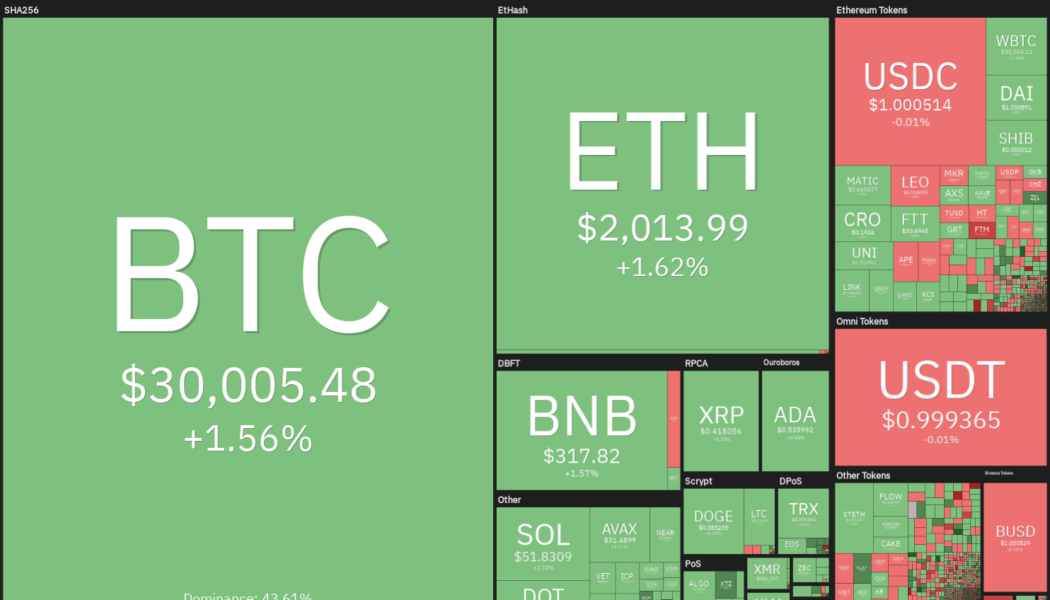
The Dow Jones Industrial Average has declined for eight consecutive weeks, the first such losing streak since 1923. On May 20, the S&P 500 briefly fell into bear market territory, indicating that traders continue to sell risky assets in fear of a recession.
Due to its tight correlation with US equities markets, Bitcoin (BTC) has remained under pressure for many weeks. The bulls are attempting to push Bitcoin higher during the weekend and avert an even longer losing streak.

Bitcoin’s performance in the first five months has been the worst since 2018, indicating that sellers are in control. However, after several weeks of weakness, the crypto markets may be on the cusp of a bear market rally.
What are the critical levels that may signal the start of a sustained recovery? Let’s study the charts of the top-5 cryptocurrencies that may outperform in the near term.
BTC/USDT
Bitcoin rebounded off the crucial support at $28,630 on May 20, indicating strong buying near this level. The bulls are attempting to push the price above the downtrend line, which could be the first indication that the selling pressure may be reducing.

Above the downtrend line, the BTC/USDT pair could rise to the 20-day exponential moving average ($31,887). The bears are likely to defend this level with vigor. If the price turns down from the 20-day EMA, the bears will once again try to sink the pair below $28,630.
If they manage to do that, the pair could drop to $26,700. This is an important level to keep an eye on because a break and close below it could open the doors for a decline to $25,000 and then to $21,800.
Conversely, if buyers thrust the price above the 20-day EMA, the pair could attempt a rally to the 61.8% Fibonacci retracement level at $34,823. If this level is scaled, the pair could climb to the 50-day simple moving average ($37,289).

The 4-hour chart shows that the price is getting squeezed between the downtrend line and $28,630. The 20-EMA and the 50-SMA have flattened out and the relative strength index (RSI) is just above the midpoint suggesting a balance between supply and demand.
This balance could tilt in favor of buyers if they push and sustain the price above the downtrend line. If that happens, the pair could start its northward march toward the 200-SMA.
On the contrary, if the price turns down from the current level, the bears will attempt to sink the pair below $28,630 and gain the upper hand.
BNB/USDT
Binance Coin (BNB) recovered sharply from the critical support at $211 and has reached the overhead resistance at the 20-day EMA ($323). This is an important level for the bears to defend because a break and close above it could indicate that a bottom may be in place.

Above the 20-day EMA, the BNB/USDT pair could rally to $350 and thereafter to the 50-day SMA ($376). This level could again act as a stiff hurdle but if bulls thrust the price above it, the pair could rally to the 200-day SMA ($451).
Contrary to this assumption, if the price turns down sharply from the 20-day EMA, it will suggest that bears have not yet given up and they continue to sell at higher levels. The pair could then drop toward $211. If the price rebounds off this level, the pair may consolidate between $211 and $320 for a few days.

The bulls are attempting to push the price above the overhead resistance at $320. If they succeed, the pair could rally toward $350. The bears are likely to defend this level aggressively. If the price turns down from $350, the pair could again drop to $320.
If the price rebounds off this level, the pair could remain range-bound between $320 and $350 for some time. The bullish momentum could pick up above the 200-SMA and the pair may rally to $380 and later to $400.
Conversely, if the price turns down from the current level, the pair could drop to $286 and then to $272.
XMR/USDT
Monero (XMR) dropped below the strong support at $134 on May 12 but the bears could not sustain the lower levels. This suggests aggressive buying on dips. The price has recovered sharply to the 20-day EMA ($179).

If bulls push and sustain the price above the 20-day EMA, the XMR/USDT pair could rise to the overhead resistance zone between the 200-day SMA ($202) and the 50-day SMA ($212). The bears are expected to mount a strong defense in this zone
If the price turns down from this zone but bulls arrest the subsequent decline at the 20-day EMA, it will suggest a potential change in trend. Conversely, if the price turns down from the current level, the bears will try to pull the pair to $150 and thereafter to $134.

The 4-hour chart shows the formation of higher lows and higher highs. The bears tried to pull the price below the 50-SMA but the bulls defended the level successfully. This suggests a change in sentiment from selling on rallies to buying on dips.
The pair could next rally to the 200-SMA where the bears may offer a strong resistance. If bulls overcome this barrier, the pair could rally to $225. Contrary to this assumption, if the price turns down and breaks below the 50-SMA, the pair could slide to $150. A break below this level could challenge the strong support at $134
Related: Dollar Cost Averaging or Lump-sum: Which Bitcoin strategy works best regardless of price?
ETC/USDT
Ethereum Classic (ETC) dropped sharply from $52 on March 29 to $16 on May 12. The bulls are attempting to start a recovery which could face resistance at the 20-day EMA ($23).

If the price turns down from the 20-day EMA, the bears will again attempt to resume the downtrend by pulling the ETC/USDT pair below the critical support at $16.
On the contrary, if buyers propel the price above the 20-day EMA, it will suggest the start of a stronger relief rally. The positive divergence on the RSI also points to the possibility of a recovery in the near term. The pair could then rise to the 38.2% Fibonacci retracement level at $30 where the bears may mount a strong resistance.

The price has been trading between $19 and $23 for some time. This suggests that the bulls are attempting to form a higher low but the bears continue to pose a strong challenge at higher levels. The flattening 20-EMA and 50-SMA do not give a clear advantage either to bulls or bears.
If buyers drive the price above $23, it will suggest the start of a new up-move. The pair could first rally to the 200-SMA and then to $33. Alternatively, if the price turns down and plummets below $19, the bears will gain the upper hand. They will then attempt to sink the pair to $16.
MANA/USDT
Decentraland (MANA) turned down from the 20-day EMA ($1.24) on May 16 but a positive sign is that the bulls did not allow the price to sustain below the psychological level at $1.

The buyers will once again attempt to push the price above the 20-day EMA. If they succeed, the MANA/USDT pair could rally to the 50-day SMA ($1.72). The bears may again mount a stiff resistance at this level but if bulls clear this hurdle, the pair could start its northward march toward the 200-day SMA ($2.72).
Contrary to this assumption, if the price slips below $1, the bears will try to sink the pair to the crucial support at $0.60. A break and close below this level could start the next leg of the downtrend.

The pair is stuck between $0.97 and $1.36, indicating that bulls are buying the dips below $1 and the bears are selling on rallies. The 20-EMA and the 50-SMA have flattened out, indicating that the consolidation may continue for some more time.
If buyers propel the price above the 50-SMA, the pair could rise to the resistance of the range at $1.36. The bullish momentum could pick up if buyers overcome this barrier. Conversely, the bears could gain the upper hand if the price turns down and plummets below the support at $0.97.
The views and opinions expressed here are solely those of the author and do not necessarily reflect the views of Cointelegraph. Every investment and trading move involves risk, you should conduct your own research when making a decision.
 [flexi-common-toolbar] [flexi-form class=”flexi_form_style” title=”Submit to Flexi” name=”my_form” ajax=”true”][flexi-form-tag type=”post_title” class=”fl-input” title=”Title” value=”” required=”true”][flexi-form-tag type=”category” title=”Select category”][flexi-form-tag type=”tag” title=”Insert tag”][flexi-form-tag type=”article” class=”fl-textarea” title=”Description” ][flexi-form-tag type=”file” title=”Select file” required=”true”][flexi-form-tag type=”submit” name=”submit” value=”Submit Now”] [/flexi-form]


Tagged: Binance Coin, Bitcoin, crypto blog, Crypto news, decentraland, ethereum classic, Markets, Monero, Price analysis