XRP Price

XRP price risks 30% decline despite Ripple’s legal win prospects
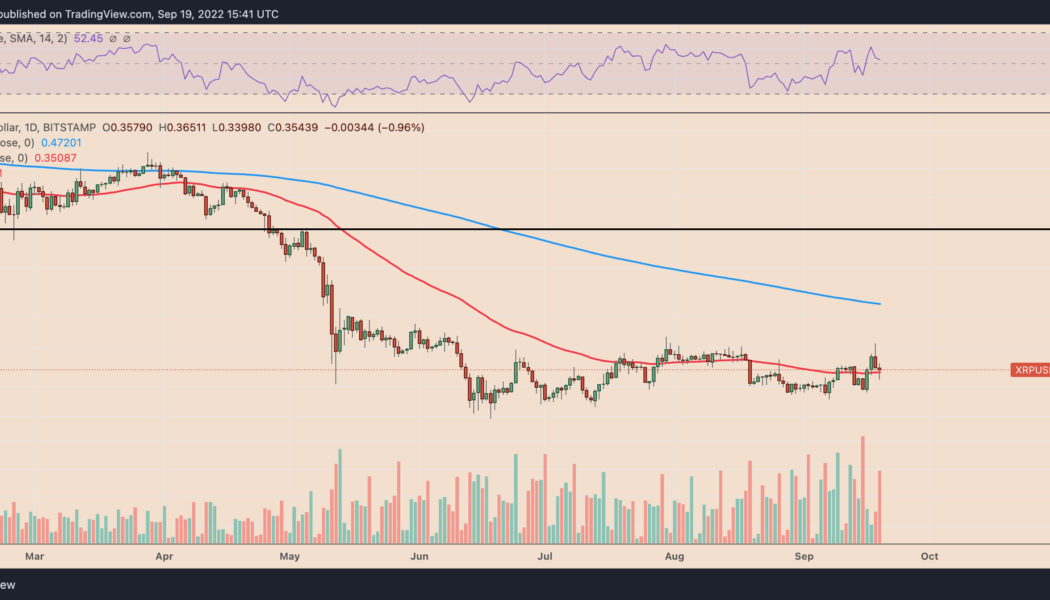
Ripple (XRP) price was wobbling between profits and losses on Sept. 19 despite hopes that Ripple would eventually win its long-running legal battle against the U.S. Securities and Exchange Commission (SEC). Ripple and the SEC both agreed to expedite the lawsuit on Friday to get an answer on whether $XRP is a security or not. From the updates of the case, it sounds like it’s in the favor of @Ripple pic.twitter.com/SAyl4VLxdM — Jeff Sekinger (@JeffSekinger) September 19, 2022 Fed spoils SEC vs. Ripple euphoria The XRP/USD pair dropped by over 1% to $0.35 while forming extremely sharp bullish and bearish wicks on its Sept. 19 daily candlestick. In other words, its intraday performance hinted at a growing bias conflict among traders. XRP/USD daily price chart. Source: TradingView The inde...

XRP price pumps and dumps amid mysterious $51M whale transfers — What’s next?
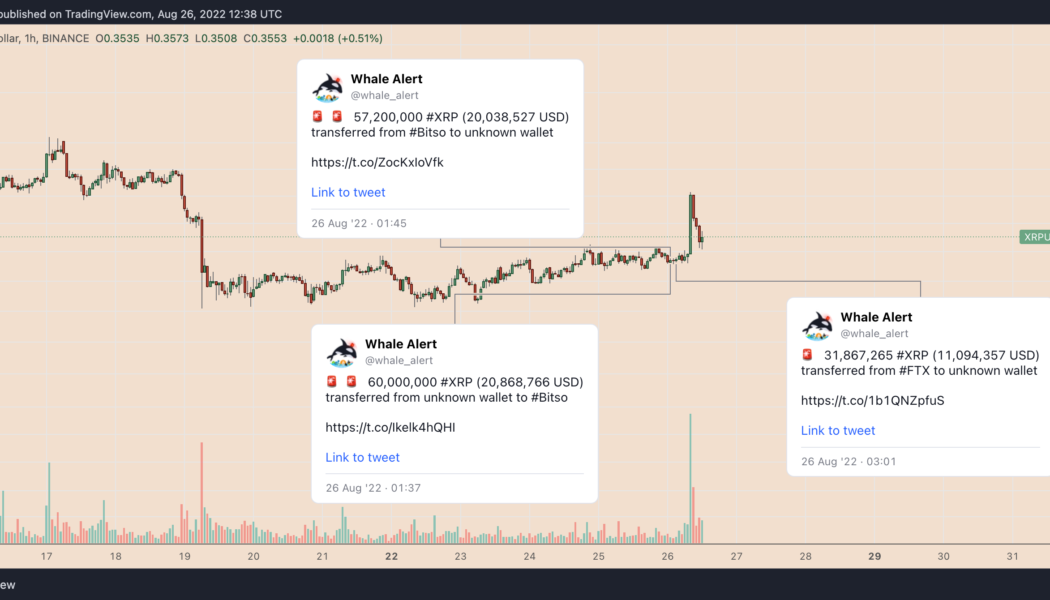
XRP price saw a major spike on Aug. 26, hinting at a possible effect from some big traders. Large XRP transfers, Ripple Swell Global event Notably, XRP’s price jumped 6% to $0.37, a two-week high, during the early London hours. The token’s upside move occurred hours after its network processed three massive transfers worth $51 million involving crypto exchanges Bitso and FTX, as highlighted by Whale Alert. XRP/USD hourly price chart. Source: TradingView XRP’s gains also came as a part of a broader upside move that started on Aug. 25, a day after Ripple announced its flagship event, “Ripple Swell Global,” to be held in London in November 2022. The market has seen similar reactions to the Swell event in the past. Bearish reversal setup in play XRP’s i...

XRP price rally stalls near key level that last time triggered a 65% crash
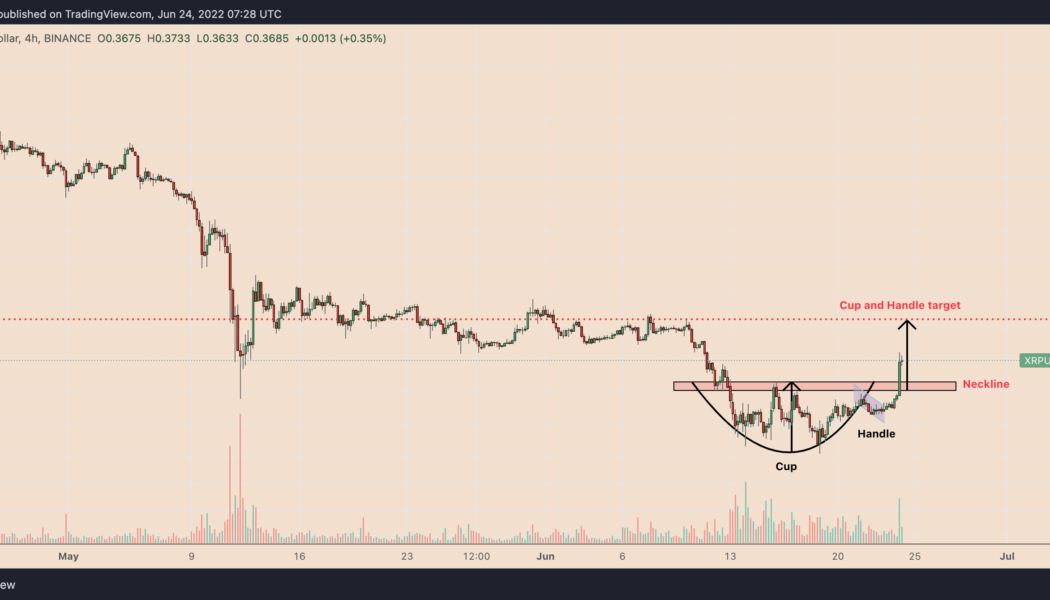
Ripple’s (XRP) ongoing upside retracement risks exhaustion as its price tests a resistance level with a history of triggering a 65% price crash. XRP price rebounds 30% XRP’s price gained nearly 30%, rising to $0.36 on June 24, four days after rebounding from $0.28, its lowest level since January 2021. The token’s retracement rally could extend to $0.41 next, according to its cup-and-handle pattern shown in the chart below. XRP/USD four-hour price chart featuring “cup and handle” pattern. Source: TradingView Interestingly, the indicator’s profit target is the same as XRP’s 50-day exponential moving average (50-day EMA; the red wave). XRP/USD daily price chart featuring 50-day EMA upside target. Source: TradingView Major resistance hurdle The cup-and-handle bullis...

3 reasons why XRP price could drop 25%-30% in March
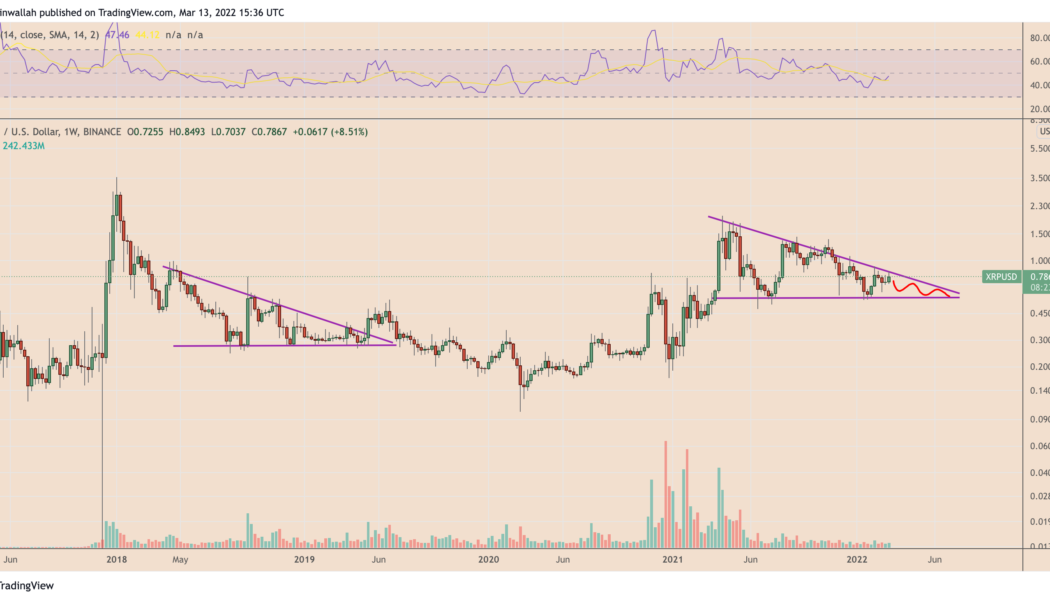
XRP price risks dropping by more than 25% in the coming weeks due to a multi-month bearish setup and fears surrounding excessive XRP supply. XRP descending triangle XRP has been consolidating inside a descending triangle pattern since topping out at its second-highest level to date — near $1.98 — in April 2021. In doing so, the XRP/USD pair has left behind a sequence of lower highs on its upper trendline while finding a solid support level around $0.55, as shown in the chart below. XRP/USD weekly candle price chart. Source: TradingView In the week ending March 13, XRP’s price again tested the triangle’s upper trendline as resistance, raising alarms that the coin could undergo another pullback move to the pattern’s support trendline near $0.55, amounting to ...
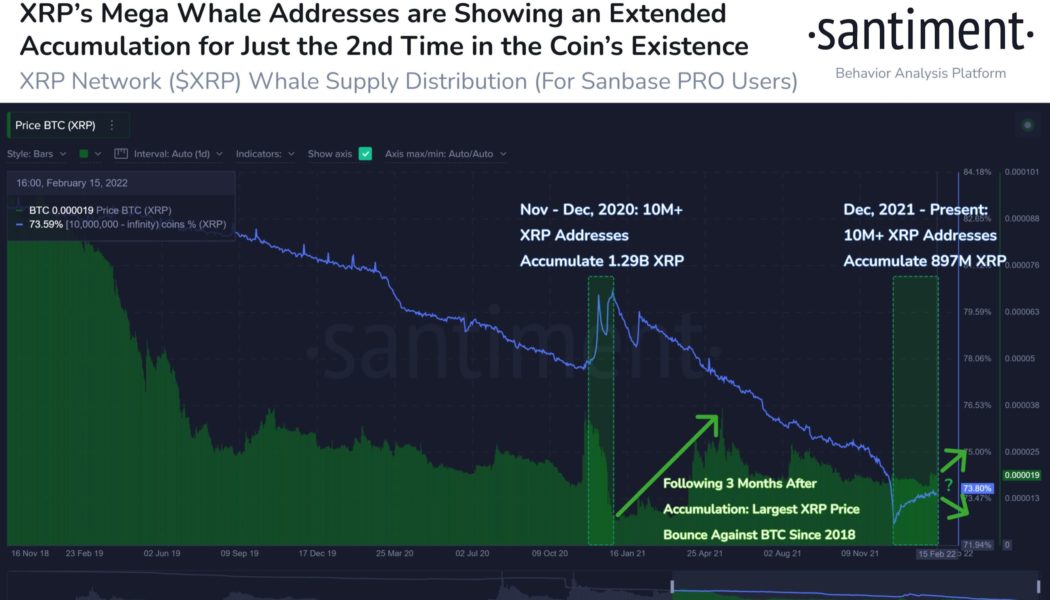

XRP ‘mega whales’ scoop up over $700M in second-biggest accumulation spree in history
XRP addresses that hold at least 10 million native units have returned to accumulating more in the past three months, a similar scenario that preceded a big rally for the XRP/USD and XRP/BTC pairs in late 2020. The return of XRP ‘mega whales’ A 76% spike in XRP “mega whale” addresses since December 2021 has been noted by analytics firm Santiment showing that they added a total of 897 million tokens, worth over $712 million today, to their reserves. The platform further highlighted that the XRP accumulation witnessed in the last three months was the second-largest in the coin’s existence. The first massive accumulation took place in November-December 2020 that saw whales depositing a total of 1.29 billion XRP to their addresses. XRP supply into ...

Can XRP price reach $1 after 25% gains in one week? Watch this key support level
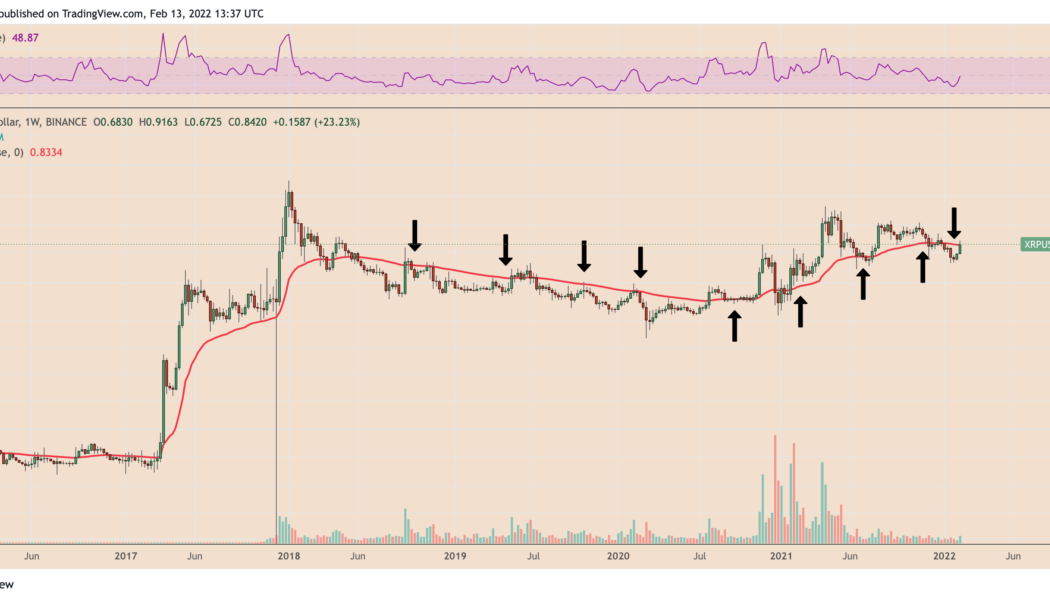
XRP price has continued to bounce back after falling by more than 70% in a correction between April 2021 and January 2022. Why the XRP/USD 50-week EMA is key On Feb. 13, XRP/USD reached as high as $0.916, above its 50-week exponential moving average (50-week EMA; the red wave) around $0.833. The upside move, albeit not decisive, opened possibilities for further bullish momentum, mainly owing to a historical buying sentiment around the said wave. XRP/USD weekly price chart featuring 50-week EMA. Source: TradingView For instance, traders had successfully reclaimed the 50-week EMA as support in the week ending July 27, 2020, more than a year after flipping the wave as resistance. Later, XRP’s price rallied by more than 820% to $1.98 in April 2021, its best level in more than three years...

Bitcoin rebound hits $45.5K as focus switches to future support retests
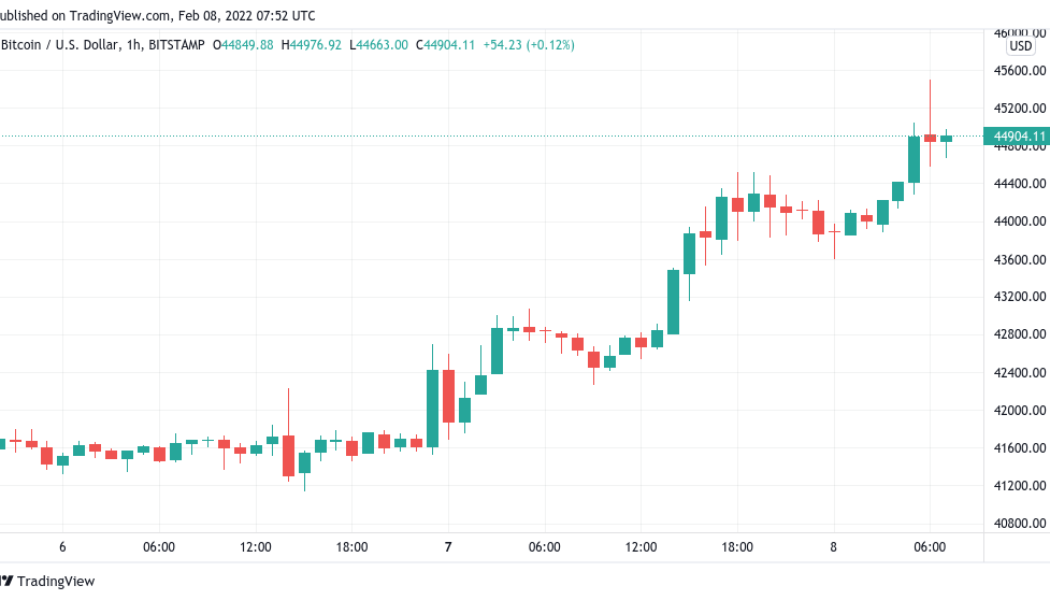
Bitcoin (BTC) hit new multi-week highs above $45,000 on Feb. 8 as the largest cryptocurrency’s comeback continued. BTC/USD 1-hour candle chart (Bitstamp). Source: TradingView $40,000 becomes popular retest target Data from Cointelegraph Markets Pro and TradingView showed BTC/USD reaching $45,500 on Bitstamp in its latest surge before consolidating. Volatility was once again in evidence as the pair fluctuated by $1,000 on intra-hour timeframes, circling $44,800 at the time of writing. Fears of a major correction were nonetheless left unfounded on the day, despite theories that $40,000 could see a retest next. lol okay a couple hundred dollars lower than previous tweet but I’m back to thinking we run it back to retest 40K idk honestly listening to this space has my brain all...

Bitcoin price flatlines as XRP hits $1 with ‘massive’ altcoin move set for 2022
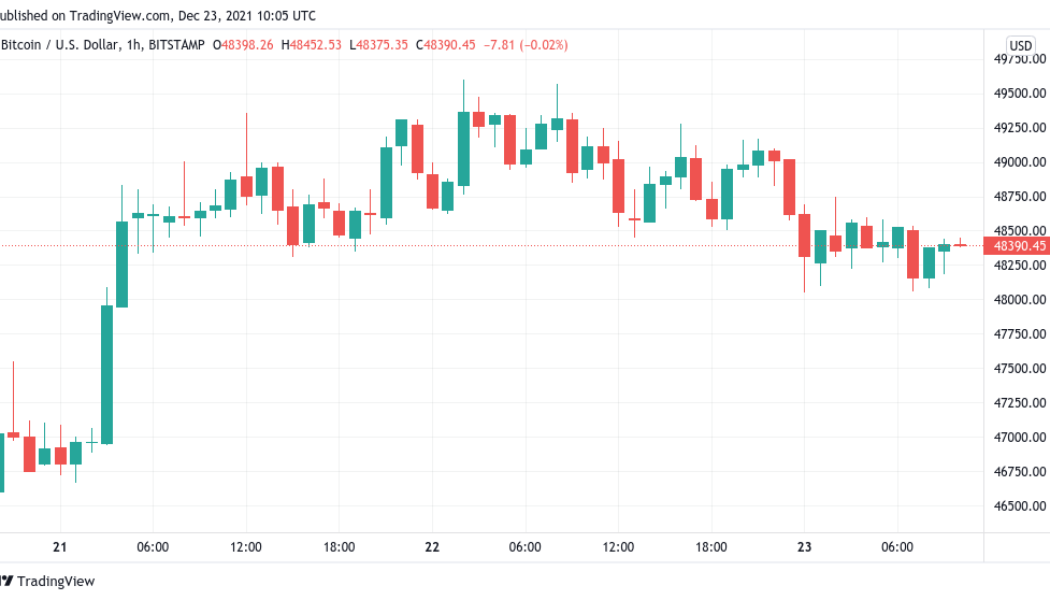
Bitcoin (BTC) stuck rigidly to its tight range on Dec. 23 as price action continued to contradict strong buying activity. BTC/USD 1-hour candle chart (Bitstamp). Source: TradingView Hodlers busy accumulating Data from Cointelegraph Markets Pro and TradingView showed BTC/USD failing to hold $49,000 after hitting 10-day highs. The pair remained stuck in a trading zone only around $4,000 wide, a key factor fuelling bets that a “short squeeze” would hit over the holiday period. Against declining volatility, data reinforced conviction among investors, with the supply being bought up at roughly three times the rate of new BTC being mined. “Strong handed HODLers are absorbing supply at more than triple the rate of new coins being mined each day,” on-chain analytics firm Glassnode summarized ...

Top 10 Types of Cryptocurrency You Ought to Know
We use cookies on our website to give you the most relevant experience by remembering your preferences and repeat visits. By clicking “Accept All”, you consent to the use of ALL the cookies. However, you may visit “Cookie Settings” to provide a controlled consent. You Deserve to Make Money Even When you are looking for Dates Online. So we reimagined what a dating should be. It begins with giving you back power. Get to meet Beautiful people, chat and make money in the process. Earn rewards by chatting, sharing photos, blogging and help give users back their fair share of Internet revenue.