Trading
ApeCoin rebounds after APE price crashes 80% in two weeks: Dead cat bounce or bottom?
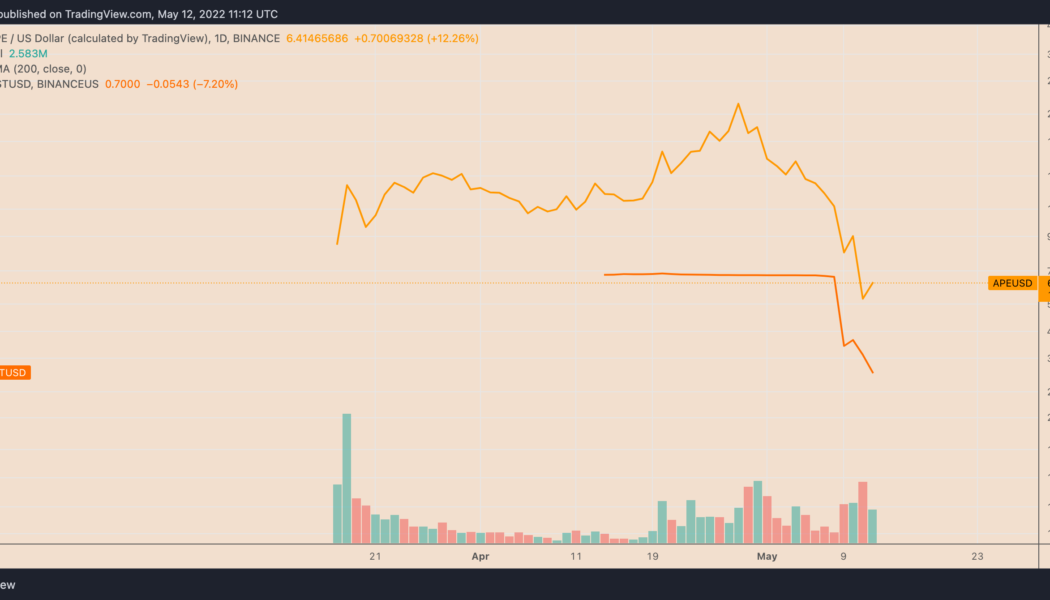
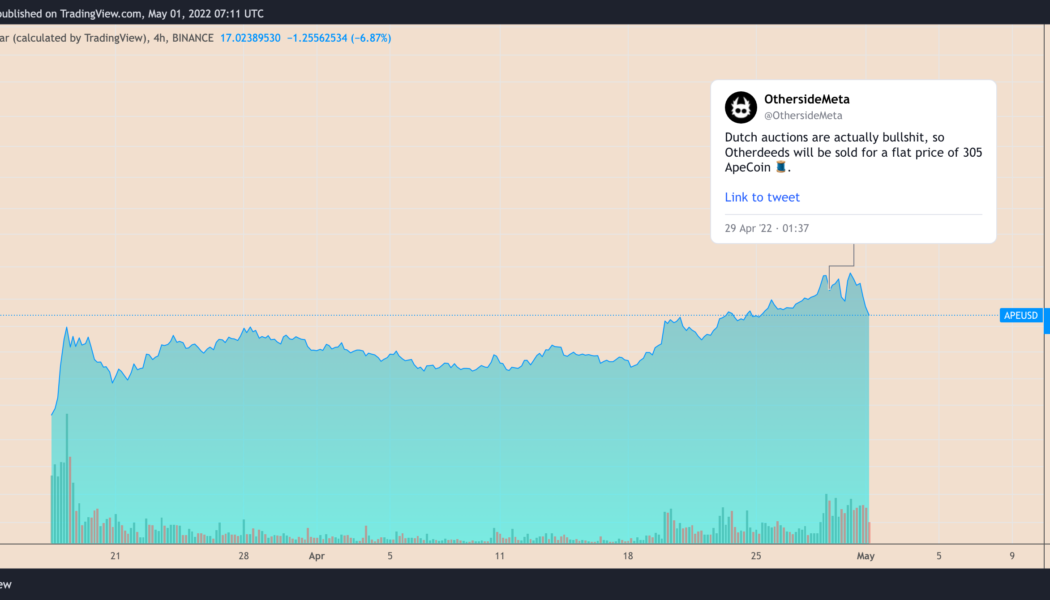
ApeCoin (APE) has undergone a sharp recovery after falling to its lowest level in two months. But its strong correlation with Bitcoin (BTC) and U.S. equities amid macro risks suggests more losses could be in store. APE rebounds after 80% losses in two weeks APE rebounded by nearly 45% to $7.30 on May 12. The upside retracement move came after APE dropped circa 81% to $5 on May 11, from its record high near $27.50, established on April 28. The seesaw price action mirrored similar volatile moves elsewhere in the crypto market, led by the chaos around TerraUSD (UST) — an “algorithmic stablecoin” whose value plunged to $0.23 earlier this week, and the Federal Reserve’s hawkish response to rising inflation. APE/USD versus USTUSD. Source: TradingView Meanwhile, the correla...
What are the top social tokens waiting to take off? | Find out now on The Market Report
“The Market Report” with Cointelegraph is live right now. On this week’s show, Cointelegraph’s resident experts discuss the social tokens you should be keeping a close eye on. But first, market expert Marcel Pechman carefully examines the Bitcoin (BTC) and Ether (ETH) markets. Are the current market conditions bullish or bearish? What is the outlook for the next few months? Pechman is here to break it down. Next up: the main event. Join Cointelegraph analysts Benton Yaun, Jordan Finneseth and Sam Bourgi as each makes his case for the top social token. First up, we have Bourgi with his pick of STEEM, the native token of the Steem social blockchain network, which rewards users for content creation. Its aim is to give back value to content creators who contribute on the platform. Although is ...
Monero avoids crypto market rout, but XMR price still risks 20% drop by June
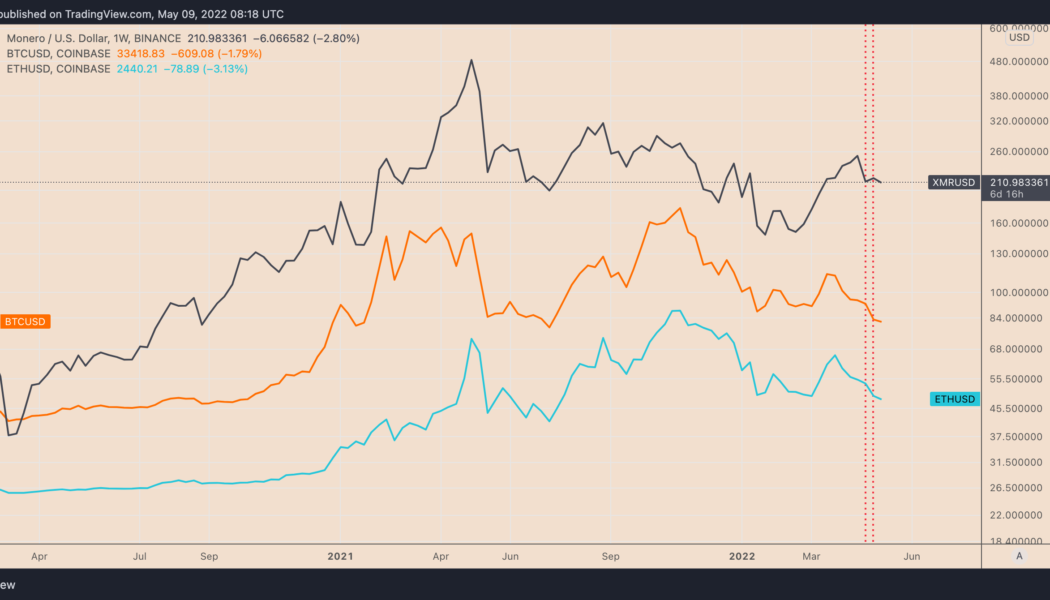
Monero (XMR) has shown a surprising resilience against the United States Federal Reserve’s hawkish policies that pushed the prices of most of its crypto rivals — including the top dog Bitcoin (BTC) — lower last week. XMR price closed the previous week 2.37% higher at $217, data from Binance shows. In comparison, BTC, which typically influences the broader crypto market, finished the week down 11.55%. The second-largest crypto, Ether (ETH), also plunged 11% in the same period. XMR/USD vs. BTC/USD vs. ETH/USD weekly price chart. Source: TradingView While the crypto market wiped off $163.25 billion from its valuation last week, down nearly 9%, Monero’s market cap increased by $87.7 million, suggesting that many traders decided to seek safety in this privacy-focused coin. XMR near ...
DOT rallies 12% in a day as Polkadot gears up to solve a major blockchain hacking problem
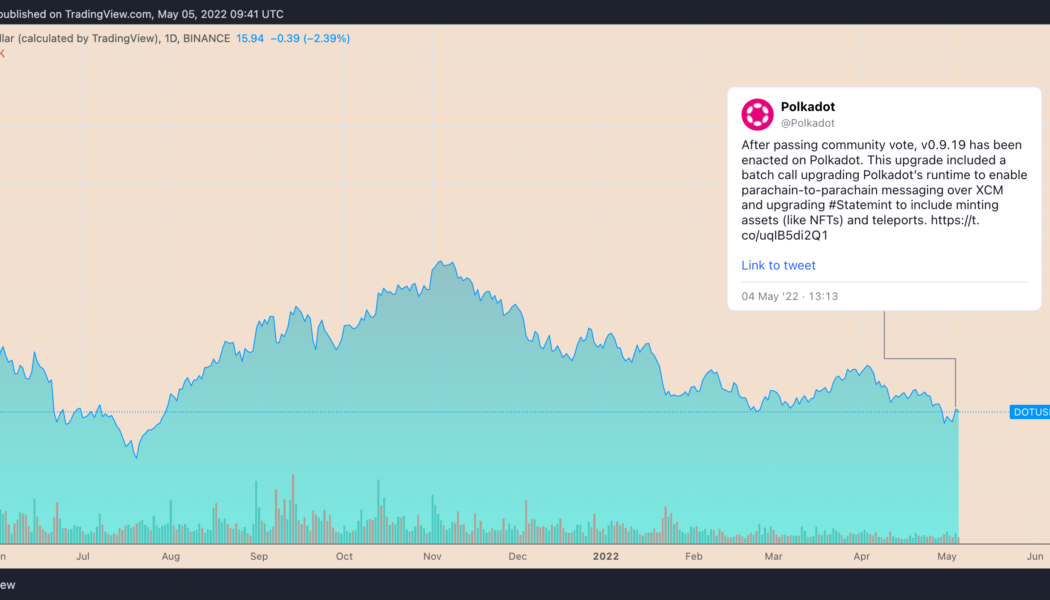
Polkadot (DOT) price ticked higher in the past 24 hours on anticipations that its new cross-chain communications protocol would solve a long-standing problem in the blockchain sector. DOT price gains 12% on XCM launch Bulls pushed DOT’s price to $16.44 on May 5 from $14.72 a day before, gaining a little over 12% as they assessed the launch of XCM, a messaging system that allows parachains — individual blockchains that operate in parallel inside the Polkadot ecosystem — to communicate with each other. DOT/USD daily price chart. Source: TradingView As Cointelegraph reported, future updates in the XCM protocol would see parachains exchanging messages without relying on Polkadot’s central blockchain, the Relay Chain. That expects to eliminate bridge hacks that have cost the in...
Ethereum risks 35% drop by June with ETH price confirming ‘ascending triangle’ fakeout
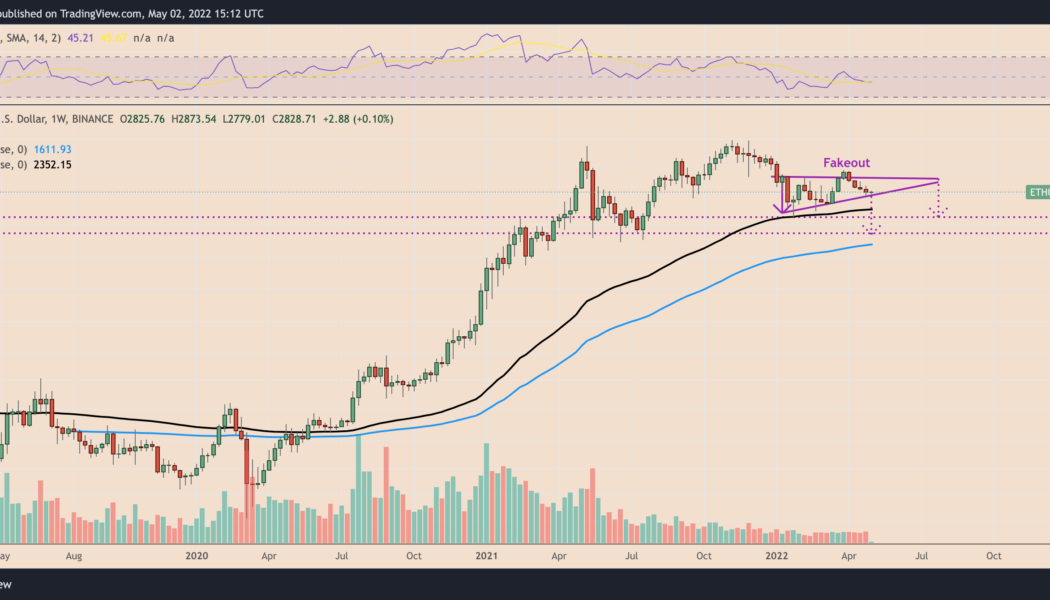
Ethereum’s native token Ether (ETH) faces the possibility of a 35% price correction in Q2 as it comes closer to breaking below its “ascending triangle” pattern. ETH price breakdown ahead? Ether’s price swung between profits and losses on May 2 while trading around $2,825, showing indecisiveness among traders about their next bias. Interestingly, the Ethereum token wobbled in the proximity of a rising trendline that constitutes an ascending triangle pattern in conjugation with a horizontal line resistance. To recap, ascending triangles are typically continuation patterns. That being said, Ether’s price was trending lower before forming its ascending triangle, raising its chances of a breakdown in the next few weeks. Another bearish sign comes from Ether&#...
The NFT sector is projected to move around $800 billion over next 2 years: Report
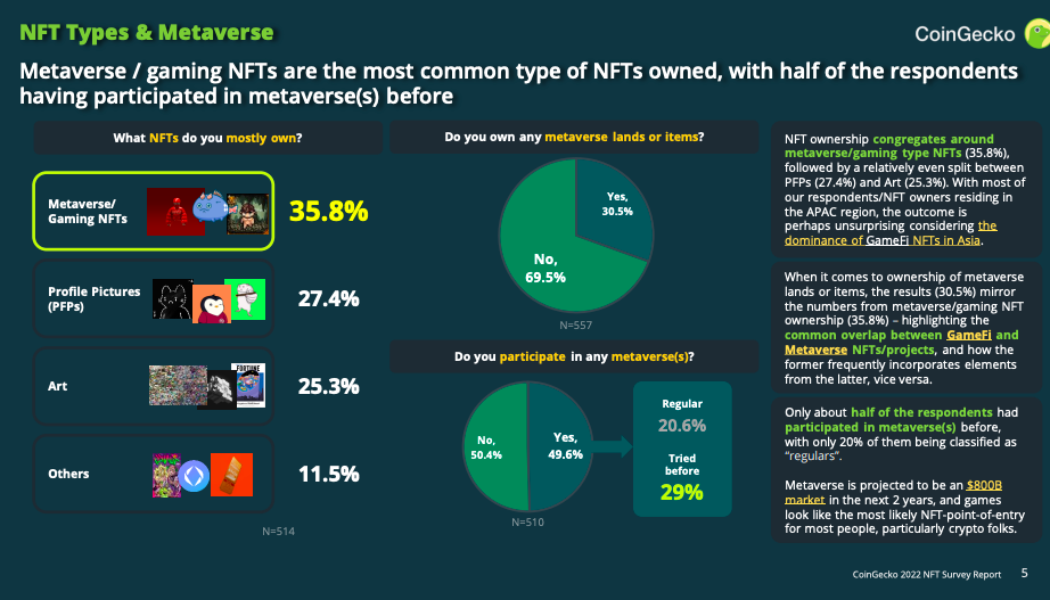
Although NFTs have been a part of the cryptocurrency market since 2014, interest and adoption ha risen rapidly over the last two years. At their height in August 2021, the total trading volume of NFTs rose to over $5 billion, kickstarting what briefly came be to known as “NFT Summer”. According to a report by Coingecko, the NFT market is now expected to move more than $800 billion in the coming two years. The report, which mostly utilized investors from Asia and the Pacific, highlighted that of 871 respondents, around 72% of them already own NFT(s), with more than 50% of them declaring that they had 5 or more. As for investors, the report indicated a balance between the generations, suggesting 43.6% of NFT investors surveyed were between 18-30 years old and 45.2% are between 30-50 yea...
Home sweet hodl: How a Bitcoiner used BTC to buy his mom a house
There’s a special bond between mothers and their sons. For pseudonymous Alan, a 28-year-old engineer, a Bitcoin (BTC) loan helped his mom to buy a house. Alan told Cointelegraph that he took out a Bitcoin-backed loan in 2021 — serendipitously on his sister’s birthday — to gift his mom the tax-free money. She then used the funds to buy a house in North Yorkshire, England, while Alan kept his Bitcoin. Yorkshire, England, known as “God’s own country.” Source: North Yorkshire City Council Alan first used Bitcoin in 2012, learning it was a useful currency to buy things on the internet. He used the peer-to-peer (P2P) service localbitcoins.com, whose team are regular Cointelegraph contributors, to buy Bitcoin. Alan described the process of buying Bitcoin from real people as a “bizarre experience....
Could XRP price lose another 70% by Q3?
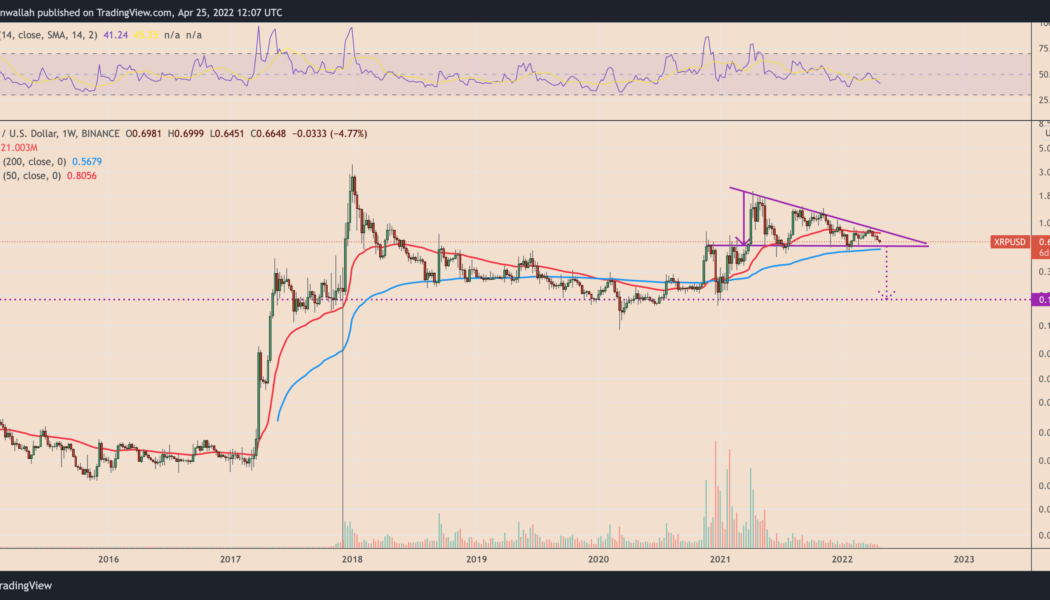
Ripple (XRP) continued its correction trend on April 25, falling by 5.5% to reach $0.64, its lowest level since Feb. 28. More XRP price downside ahead? The plunge increased the possibility of triggering a bearish reversal setup called descending triangle. While these patterns form usually during a downtrend, their occurrences following strong bullish moves usually mark the end of the uptrend. XRP has been in a similar trading channel since April 2022, bounded by two trendlines: a lower horizontal and an upper downward sloping. The pattern now nears its resolve as XRP pulls back toward the support trendline that’s also coinciding with the 50-week exponential moving average (50-week EMA; the blue wave), five weeks after testing the upper trendline as resistance. XRP/USD weekl...
Monero ‘falling wedge’ breakout positions XMR price for 75% rally
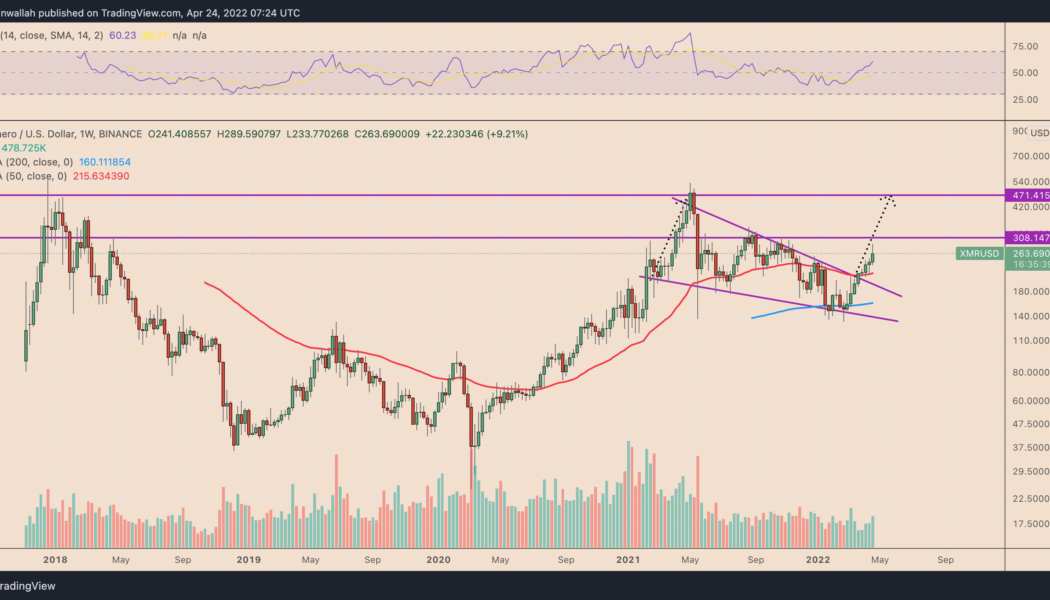
Monero (XMR) price dropped by nearly 10% three days after establishing a week-to-date high around $290 on April 24. Nonetheless, several technical indicators suggest that the XMR/USD pair is poised to resume its uptrend over the next few months. Falling wedge breakout underway Notably, XMR’s price broke out of its “falling wedge” structure in late March. It continued its move upside in the later daily sessions, with rising volumes indicating bullish sentiment among Monero traders. Traditional analysts consider falling wedges as bullish reversal patterns, i.e., the price first consolidates within a contracting, descending channel, followed by a strong bounce to the upside. As a rule, the falling wedge’s breakout target comes to be near the level at length equal to th...
DeFi token AAVE eyes 40% rally in May but ‘bull trap’ risks remain
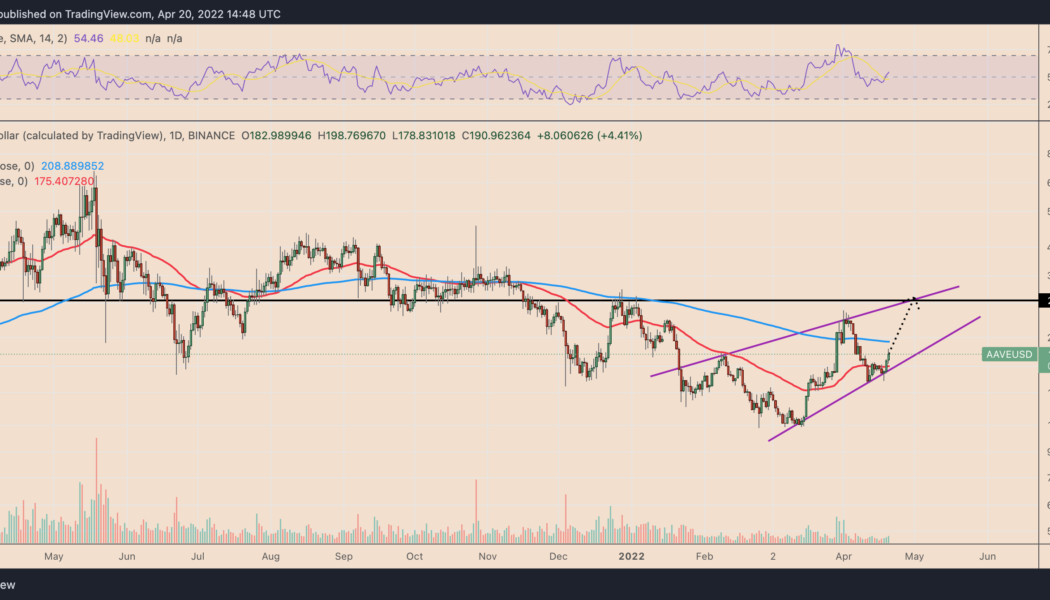
A sharp rebound move witnessed in the Aave (AAVE) market in the last three days has raised its potential to rise further in May, a technical indicator suggests. AAVE price rebounds from key support Dubbed a “rising wedge,” the pattern appears when the price rises inside a range defined by two ascending, contracting trendlines. It typically resolves after the price breaks below the lower trendline with convincingly rising volumes. AAVE has been painting a similar ascending channel since early February 2022. The AAVE/USD pair has bounced in the past few days after testing the wedge’s lower trendline as support. This means the bulls are now eyeing the pattern’s upper trendline near $280, up over 40% from April 20’s price. AAVE/USD daily price chart. Sou...
