Technical Analysis
Dogecoin signals bottoming out as DOGE rebounds 30% in two weeks — What’s next?
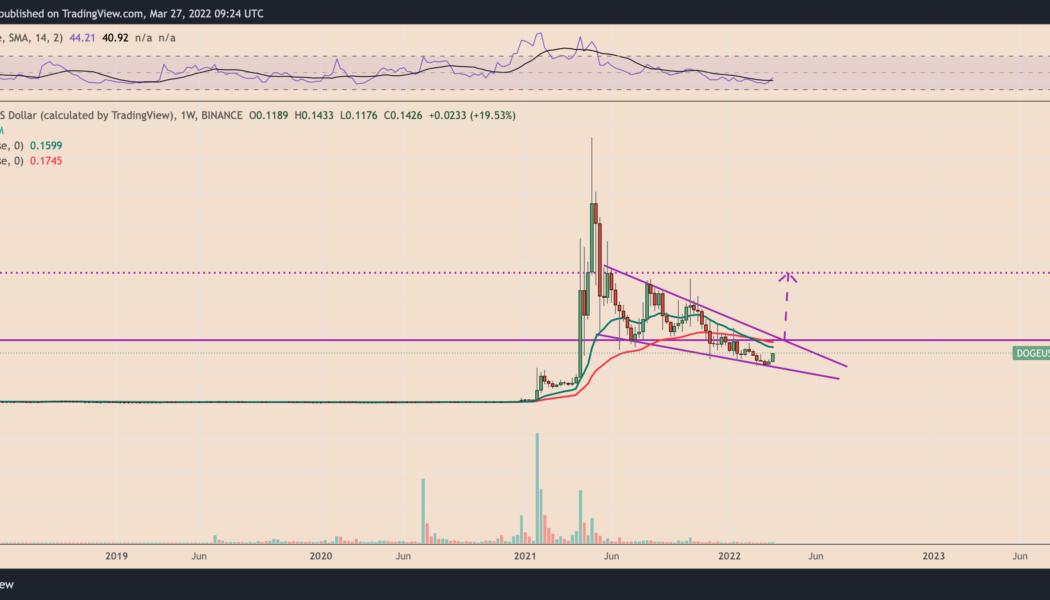
A brutal correction witnessed in the Dogecoin (DOGE) market between May 2021 and February 2022, which saw the price dropping by almost 85%, appears to have come to a halt this month. DOGE/USD rebounds 30% in two weeks DOGE experienced strong dip-buying when its price crashed to levels around $0.10 two weeks ago, resulting in a 30% rebound move to $0.14 as of March 27. Meanwhile, the coin’s upside retracement originated at a support level that constitutes a “falling wedge” setup, signaling an extended bullish reversal in the weekly sessions ahead. In detail, a falling wedge pattern occurs when the price trends lower while fluctuating between two downward sloping, converging trendlines. In a perfect scenario, the setup results into the price breaking out of the descending r...
Cardano pares most of its Q1 losses as ADA rebounds 60% in a month — What’s next?
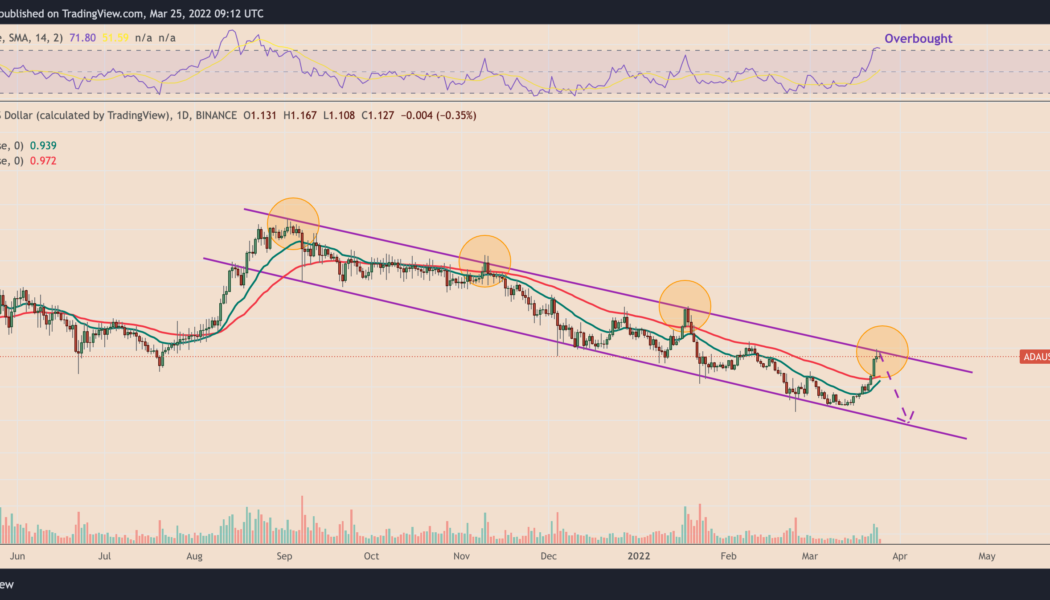
Cardano (ADA) inched higher on March 25, putting itself on course recoup a great portion of losses that it had incurred in the first two months of this year. Cardano: not so bullish yet? ADA’s price jumped by around 7.5% in trading Friday, reaching $1.19 over a month after bottoming out at around $0.75. The Cardano token’s huge rebound move netted around 60% in gains. Nonetheless, it remained at the risk of losing its upside momentum in the coming weeks. At the core of this bearish analogy is a multi-month descending channel pattern, with a reliable track record of causing and limiting ADA’s rebound attempts simultaneously since September 2021. The channel’s upper trendline particularly has served as an ideal selloff zone, now being tested again as resistance, as sh...
3 reasons why XRP price could drop 25%-30% in March
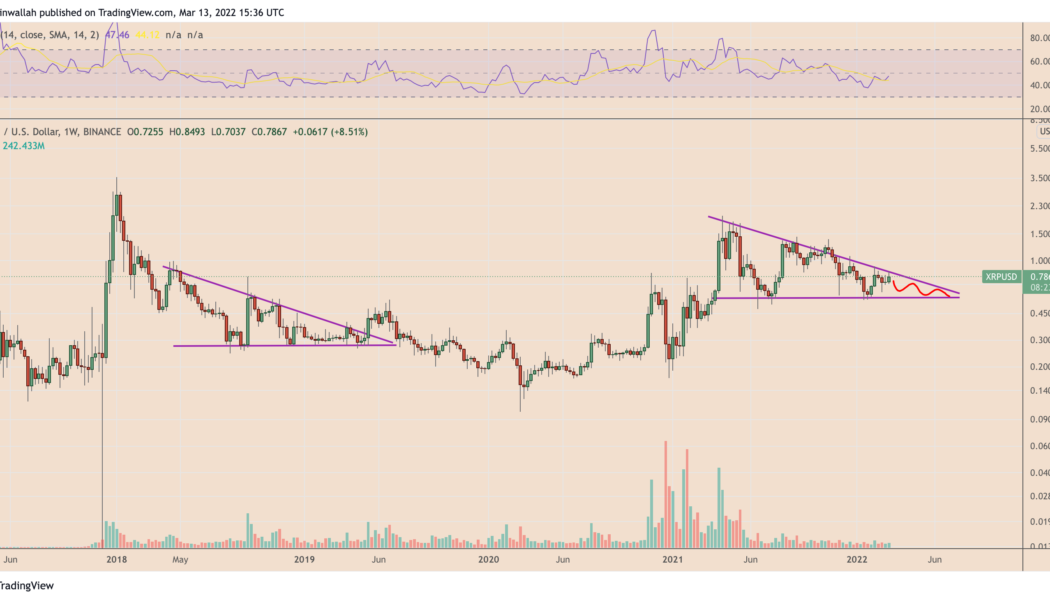
XRP price risks dropping by more than 25% in the coming weeks due to a multi-month bearish setup and fears surrounding excessive XRP supply. XRP descending triangle XRP has been consolidating inside a descending triangle pattern since topping out at its second-highest level to date — near $1.98 — in April 2021. In doing so, the XRP/USD pair has left behind a sequence of lower highs on its upper trendline while finding a solid support level around $0.55, as shown in the chart below. XRP/USD weekly candle price chart. Source: TradingView In the week ending March 13, XRP’s price again tested the triangle’s upper trendline as resistance, raising alarms that the coin could undergo another pullback move to the pattern’s support trendline near $0.55, amounting to ...
Terra’s Mirror Protocol MIR rebounds 40% two days after crashing to record low
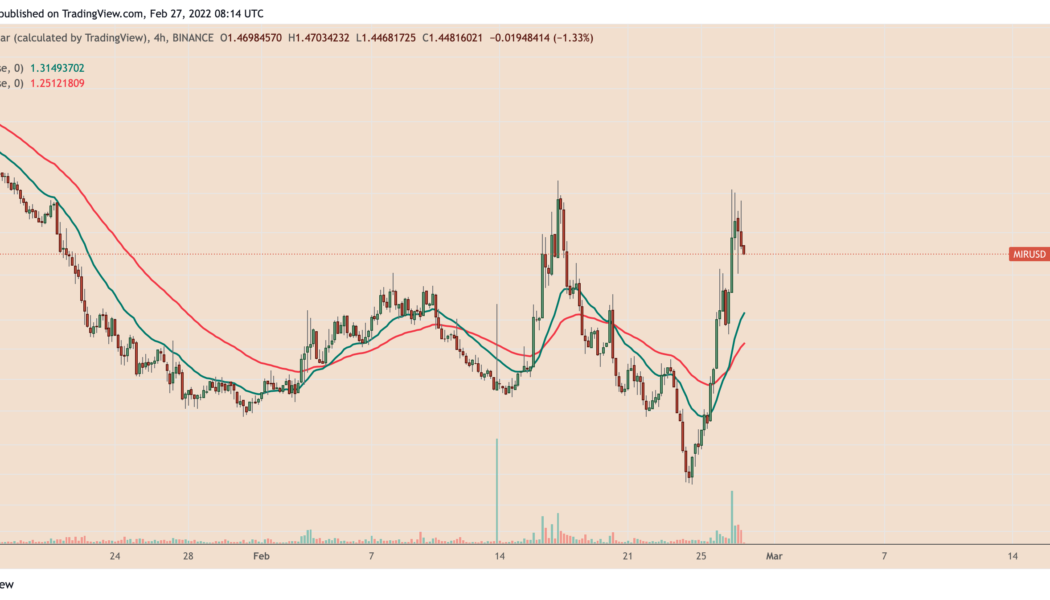
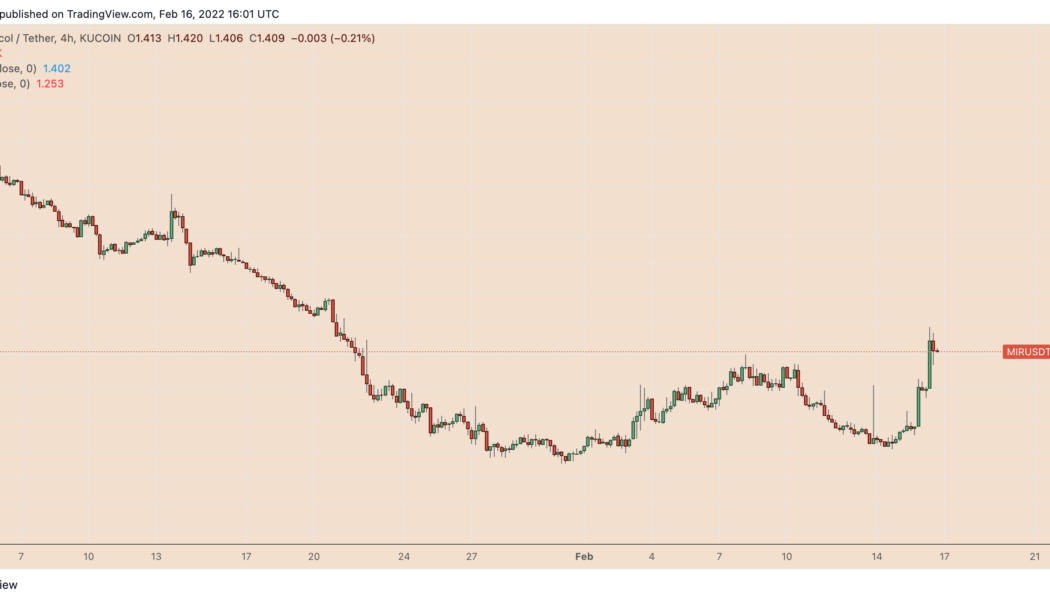
Mirror Protocol, a decentralized finance (DeFi) protocol built on the Terra blockchain, was hit by one of the biggest collapses in financial history this week after Vladimir Putin ordered military strikes against Ukraine. Terra tokens rally Mirror Protocol’s native token, MIR, dropped to $0.993 on Feb. 24, its worst level to date amid a selloff across the broader crypto market. But a sharp rebound ensued, taking the price to as high as $1.41 two days later, up more than 40% when measured from MIR’s record low. MIR/USD four-hour price chart. Source: TradingView Just like the drop, MIR’s upside retracement came in the wake of similar recoveries elsewhere in the crypto market. But interestingly, MIR/USD returns appeared larger than some of the highly valued digital assets, i...
Can Bitcoin break out vs. tech stocks again? Nasdaq decoupling paints $100K target
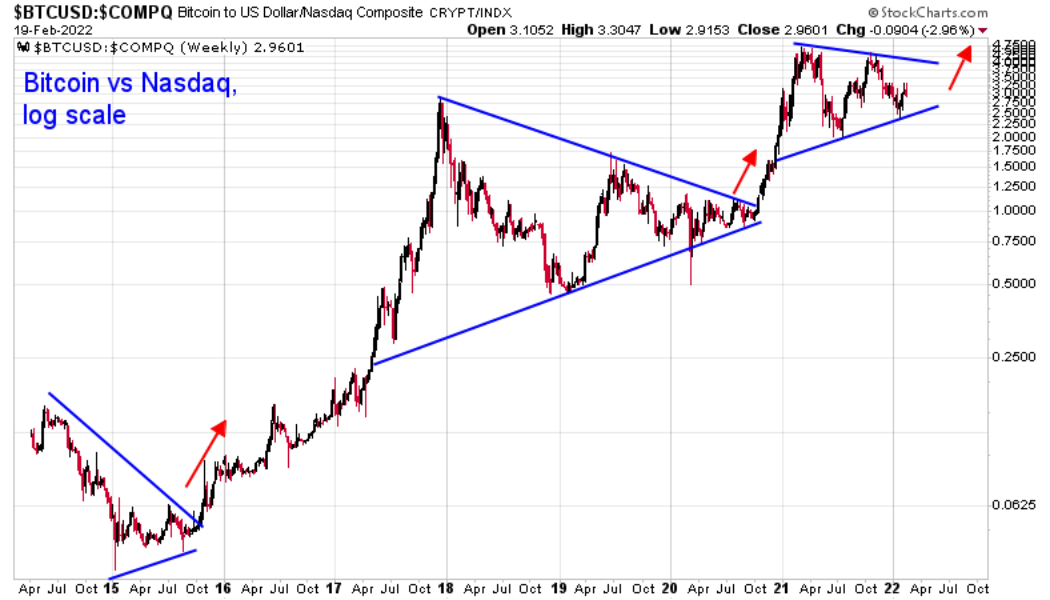
A potential decoupling scenario between Bitcoin (BTC) and the Nasdaq Composite can push BTC price to reach $100,000 within 24 months, according to Tuur Demeester, founder of Adamant Capital. Bitcoin outperforms tech stocks Demeester depicted Bitcoin’s growing market valuation against the tech-heavy U.S. stock market index, highlighting its ability to break out every time after a period of strong consolidation. “It may do so again within the coming 24 months,” he wrote, citing the attached chart below. BTC/USD vs. Nasdaq Composite weekly price chart. Source: Tuur Demeester, StockCharts.com BTC’s price has grown from a mere $0.06 to as high as $69,000 more than a decade after its introduction to the market, as per data tracked by the BraveNewCoin Liquid Index fo...
XRP ‘mega whales’ scoop up over $700M in second-biggest accumulation spree in history
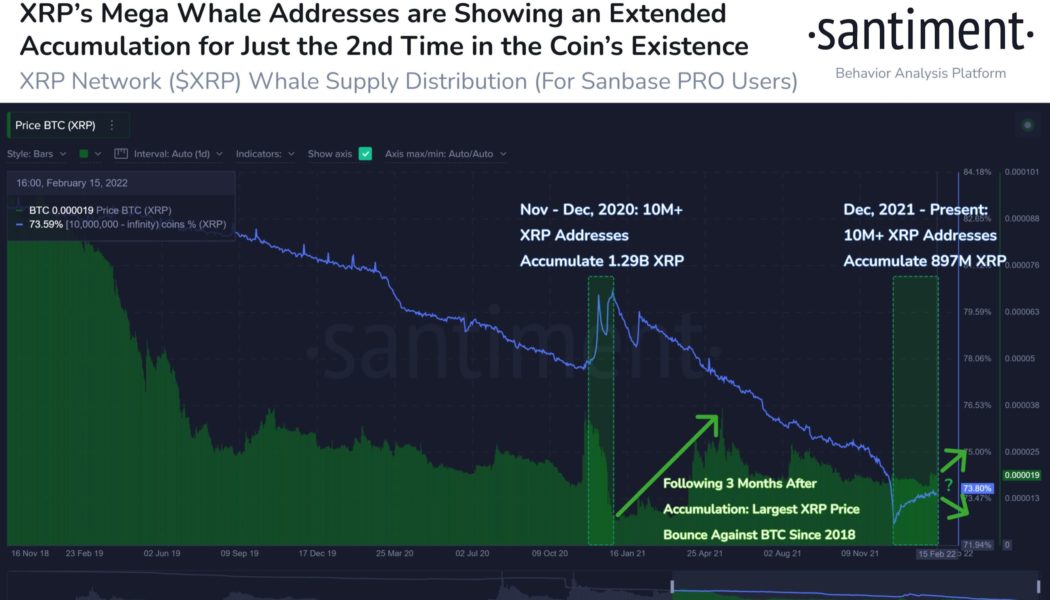
XRP addresses that hold at least 10 million native units have returned to accumulating more in the past three months, a similar scenario that preceded a big rally for the XRP/USD and XRP/BTC pairs in late 2020. The return of XRP ‘mega whales’ A 76% spike in XRP “mega whale” addresses since December 2021 has been noted by analytics firm Santiment showing that they added a total of 897 million tokens, worth over $712 million today, to their reserves. The platform further highlighted that the XRP accumulation witnessed in the last three months was the second-largest in the coin’s existence. The first massive accumulation took place in November-December 2020 that saw whales depositing a total of 1.29 billion XRP to their addresses. XRP supply into ...
Terra’s Mirror Protocol shows first signs of bottoming after price gains 30% in 48 hours
Mirror Protocol, a decentralized finance (DeFi) protocol built atop the Terra blockchain, was among the biggest gainers in the last 48 hours, primarily as its native token MIR rallied by over 30% to $1.48, its highest level since Jan. 22. MIR/USD four-hour price chart. Source: TradingView Has Mirror Protocol bottomed out? MIR price rose despite an absence of concrete fundamentals, a sight pretty common across crypto assets. As a result, its rally may have been purely technically-driven, especially because it originated after MIR had dropped by more than 90% in value from its May 2021 high near $13, making the token extremely oversold. IncomeSharks, an independent market analyst, called MIR’s rebound move a “no brainer,” noting that its multi-month drop had left ...
Can XRP price reach $1 after 25% gains in one week? Watch this key support level
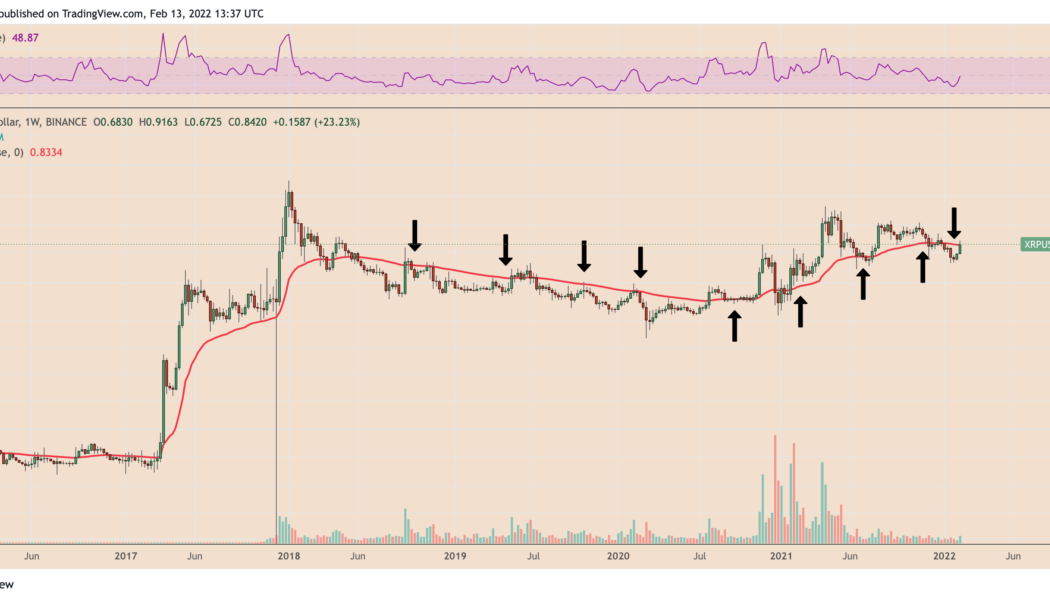
XRP price has continued to bounce back after falling by more than 70% in a correction between April 2021 and January 2022. Why the XRP/USD 50-week EMA is key On Feb. 13, XRP/USD reached as high as $0.916, above its 50-week exponential moving average (50-week EMA; the red wave) around $0.833. The upside move, albeit not decisive, opened possibilities for further bullish momentum, mainly owing to a historical buying sentiment around the said wave. XRP/USD weekly price chart featuring 50-week EMA. Source: TradingView For instance, traders had successfully reclaimed the 50-week EMA as support in the week ending July 27, 2020, more than a year after flipping the wave as resistance. Later, XRP’s price rallied by more than 820% to $1.98 in April 2021, its best level in more than three years...
Polygon price risks 50% drop as MATIC paints inverted cup and handle pattern
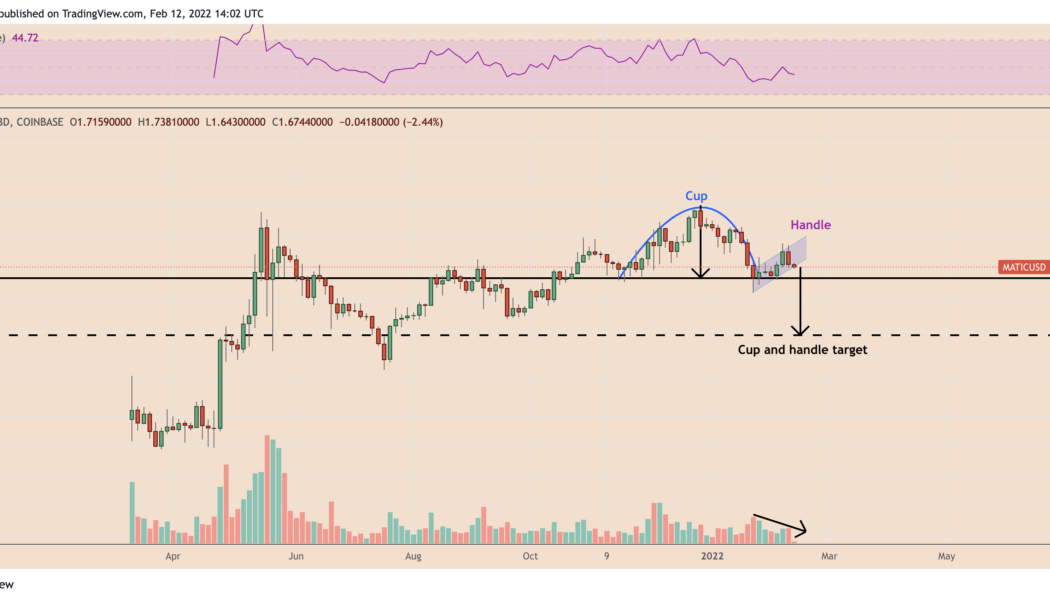
Polygon (MATIC) has dropped by more than 40% from its record high of $2.92, established on Dec. 27, 2021. But if a classic technical indicator is to be believed, the token has more room to drop in the sessions ahead. MATIC price chart painting classic bearish pattern MATIC’s recent rollover from bullish to bearish, followed by a rebound to the upside, has led to the formation of what appears like an inverted cup and handle pattern — a large crescent shape followed by a less extreme upside retracement, as shown in the chart below. MATIC/USD three-day price chart featuring inverted cup and handle pattern. Source: TradingView In a “perfect” scenario, inverted cup and handle setups set the stage for a downturn ahead. As they do, the price tends to fall towards levels tha...
Axie Infinity token AXS gains 40% after taking steps to avoid ‘permanent economic collapse’
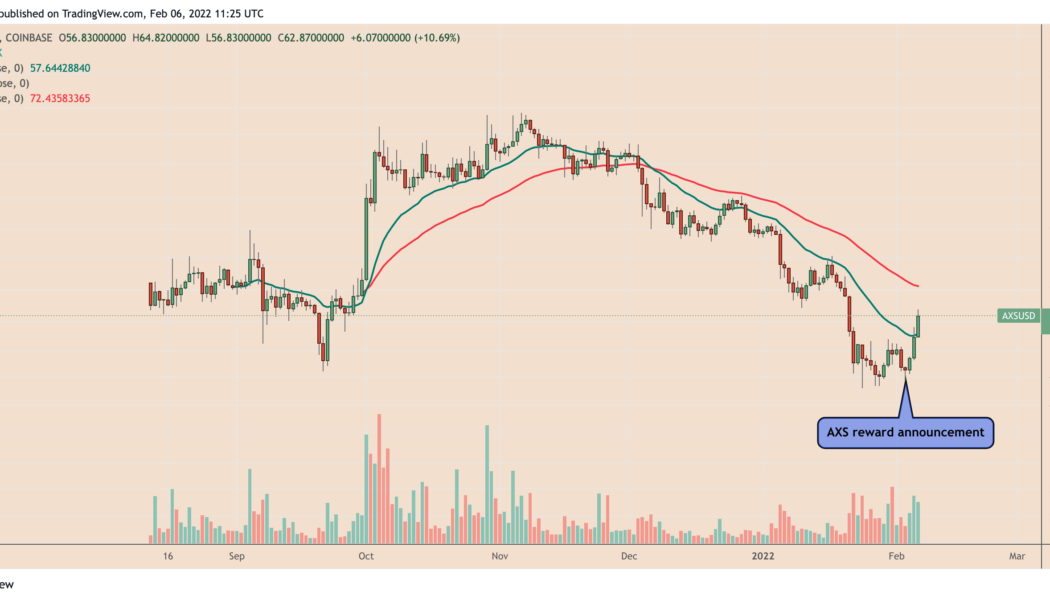
The price of the Axie Infinity (AXS) token has surged by nearly 40% in three days. AXS rallied to over $65, its best level in more than two weeks, as Axie Infinity revealed a revamped reward structure for its player-vs-player (PVP) competition round. In detail, the play-to-earn startup expanded its number of leaderboard slots to 300,000 and boosted the amount of AXS rewards to 117,676 from the earlier 3,000 for the next season. “This will supercharge the competitive Axie scene and create more demand for quality Axie teams in the ecosystem,” Axie Infinity explained, adding that their move would create a $6 million worth of prize pool for Season 20. AXS/USD daily price chart. Source: TradingView Economic revamp boosts AXS demand AXS serves as a governance token for the Axie ...
Can Ethereum price reach $4K after a triple-support bounce?
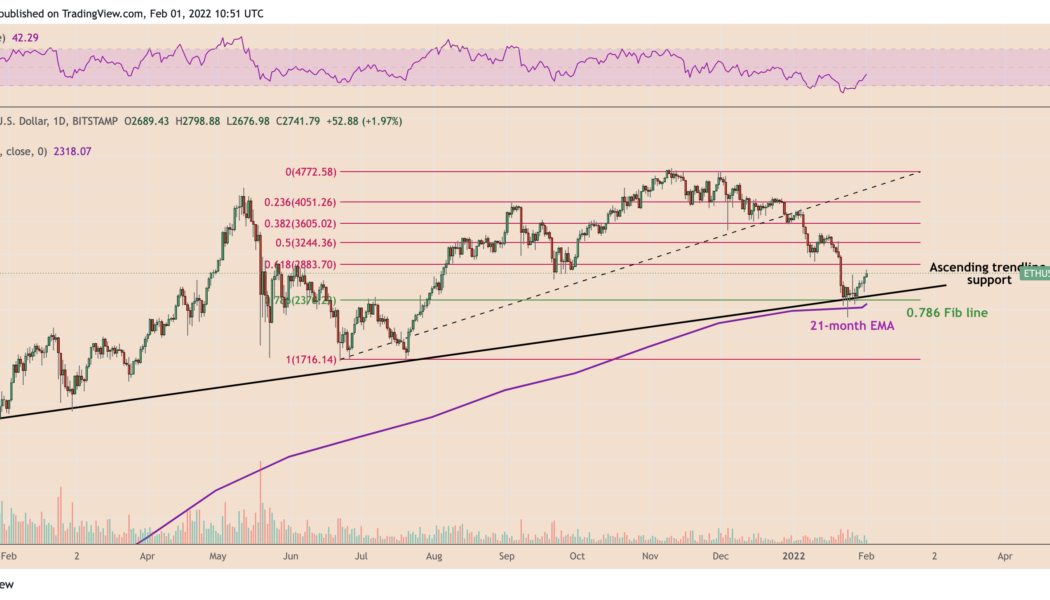
Ethereum’s native token Ether (ETH) looks ready to continue its ongoing rebound move toward $4,000, according to a technical setup shared by independent market analyst Wolf. Classic bullish reversal pattern in the works? The pseudonymous chart analyst discussed the role of at least three support levels in pushing the ETH price up by nearly 30% from its local bottom of $2,160. These price floors included a 21-month exponential moving average, the 0.786 Fib level of a Fibonacci retracement graph drawn from $1,716-swing low to $4,772-swing high, and the lower boundary of an ascending triangle pattern. ETH/USD daily price chart featuring the three-supports. Source: TradingView Wolf noted that the triple-support scenario could push Ether price to $3,330. In doing so, ...
