Technical Analysis
Could XRP price lose another 70% by Q3?
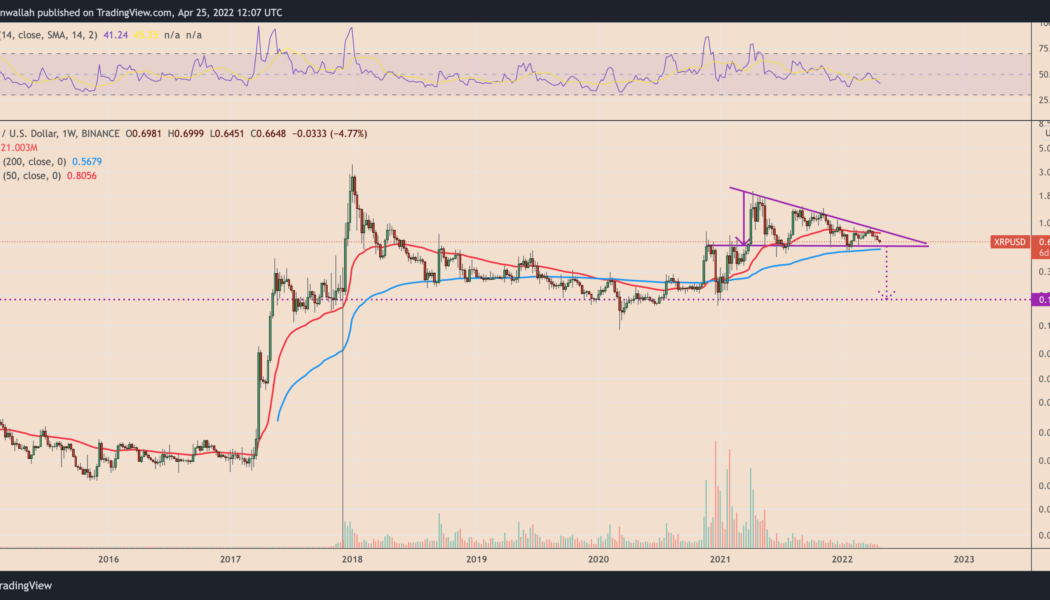
Ripple (XRP) continued its correction trend on April 25, falling by 5.5% to reach $0.64, its lowest level since Feb. 28. More XRP price downside ahead? The plunge increased the possibility of triggering a bearish reversal setup called descending triangle. While these patterns form usually during a downtrend, their occurrences following strong bullish moves usually mark the end of the uptrend. XRP has been in a similar trading channel since April 2022, bounded by two trendlines: a lower horizontal and an upper downward sloping. The pattern now nears its resolve as XRP pulls back toward the support trendline that’s also coinciding with the 50-week exponential moving average (50-week EMA; the blue wave), five weeks after testing the upper trendline as resistance. XRP/USD weekl...
Monero ‘falling wedge’ breakout positions XMR price for 75% rally
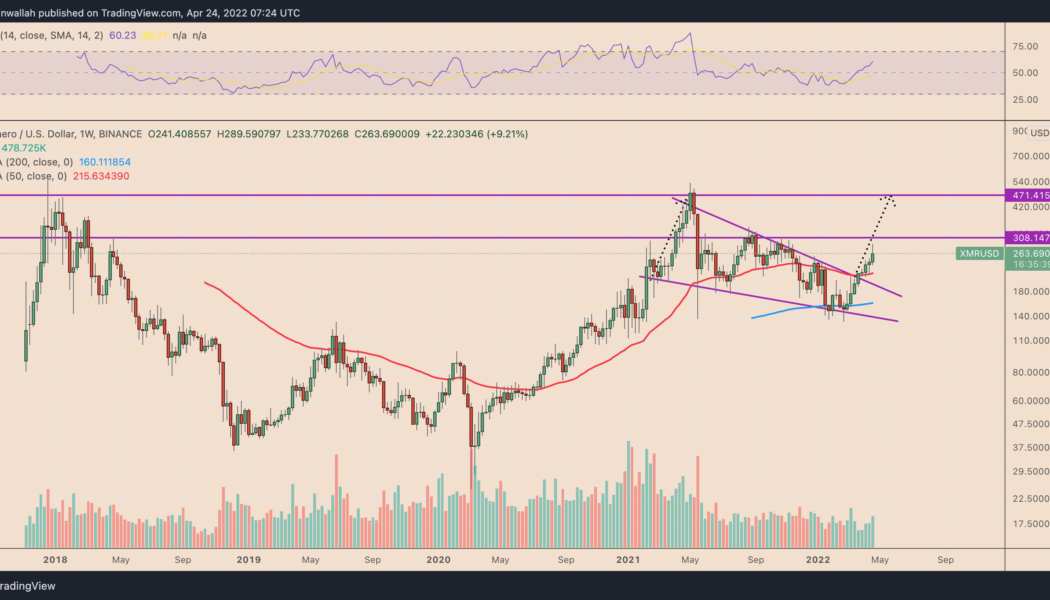
Monero (XMR) price dropped by nearly 10% three days after establishing a week-to-date high around $290 on April 24. Nonetheless, several technical indicators suggest that the XMR/USD pair is poised to resume its uptrend over the next few months. Falling wedge breakout underway Notably, XMR’s price broke out of its “falling wedge” structure in late March. It continued its move upside in the later daily sessions, with rising volumes indicating bullish sentiment among Monero traders. Traditional analysts consider falling wedges as bullish reversal patterns, i.e., the price first consolidates within a contracting, descending channel, followed by a strong bounce to the upside. As a rule, the falling wedge’s breakout target comes to be near the level at length equal to th...
DeFi token AAVE eyes 40% rally in May but ‘bull trap’ risks remain
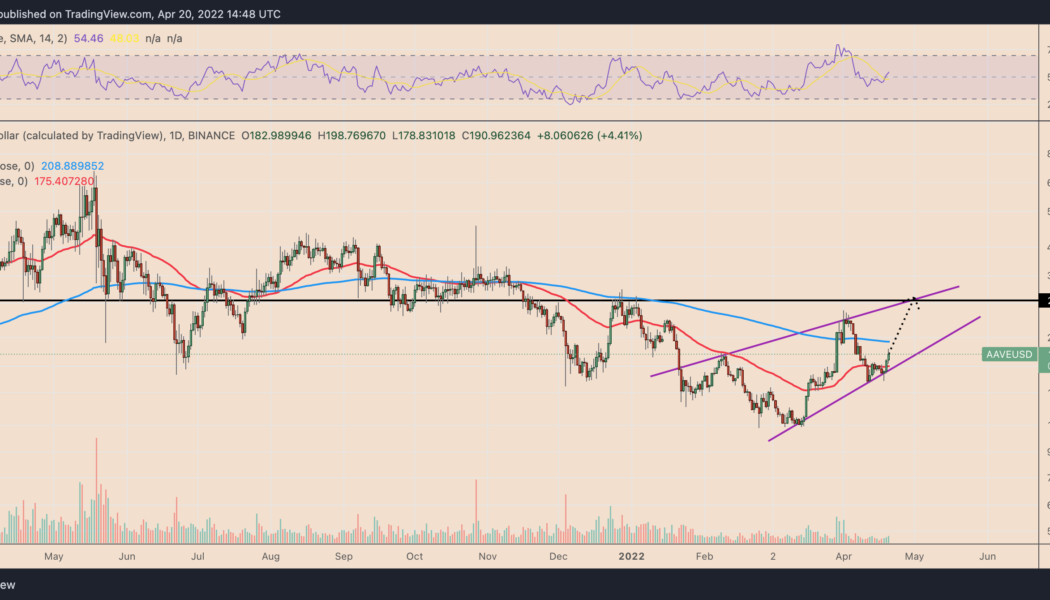
A sharp rebound move witnessed in the Aave (AAVE) market in the last three days has raised its potential to rise further in May, a technical indicator suggests. AAVE price rebounds from key support Dubbed a “rising wedge,” the pattern appears when the price rises inside a range defined by two ascending, contracting trendlines. It typically resolves after the price breaks below the lower trendline with convincingly rising volumes. AAVE has been painting a similar ascending channel since early February 2022. The AAVE/USD pair has bounced in the past few days after testing the wedge’s lower trendline as support. This means the bulls are now eyeing the pattern’s upper trendline near $280, up over 40% from April 20’s price. AAVE/USD daily price chart. Sou...
DOGE price analysis hints at 30% drop despite Elon Musk’s Twitter bid
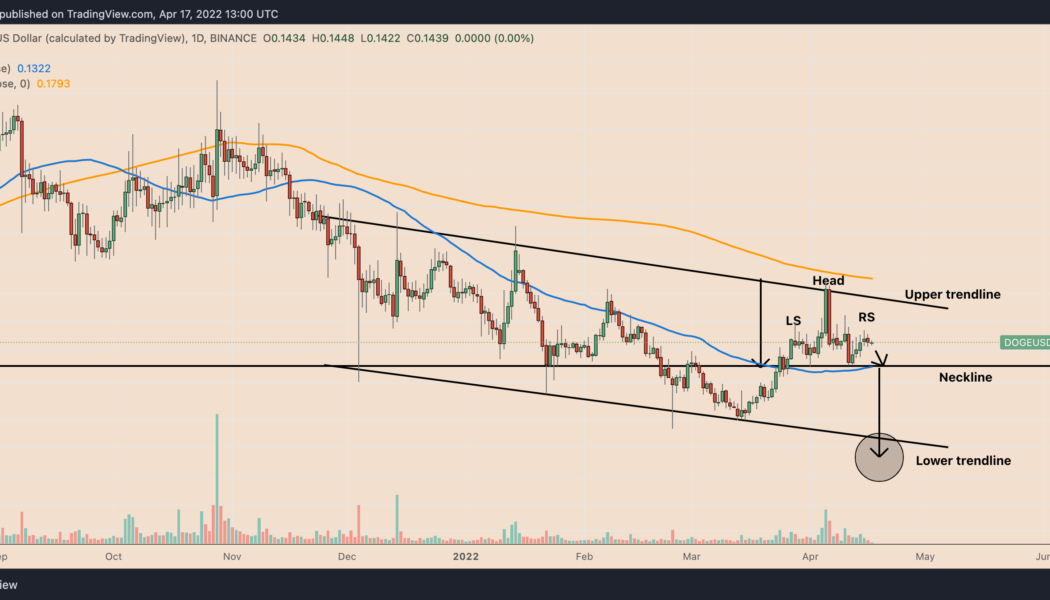
The brief Dogecoin (DOGE) price rally last week following Tesla CEO Elon Musk’s bid to buy Twitter appears to be fizzling out as DOGE closes the week over 8%. DOGE’s price dropped to $0.142 on April 17, three days after peaking out locally at $0.149. The Dogecoin correction, albeit modest, raised its potential to trigger a classic bearish reversal pattern with an 85% success rate of reaching its downside target. DOGE price eyes drop under $0.10 Dubbed head and shoulders (H&S), the pattern appears when the price forms three peaks in a row, with the middle one, called the “head,” in between the other two, which are of almost equal height, and are thus called the left and right “shoulders.” These three peaks hold above a common support ...
ApeCoin eyes 250% rally amid ‘bull pennant’ breakout, Robinhood APE listing rumors
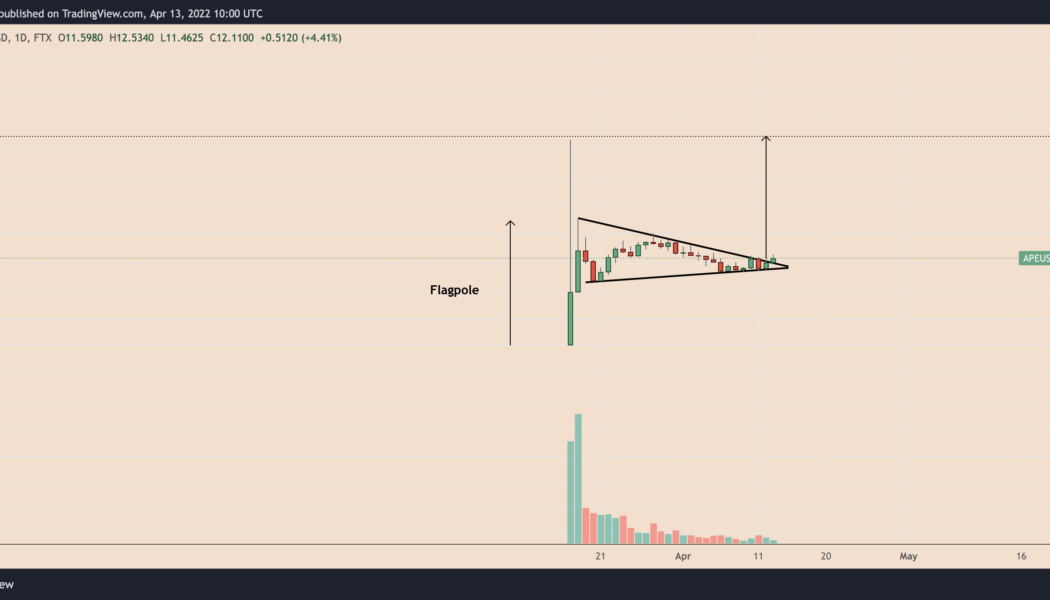
ApeCoin’s (APE) market valuation could grow by nearly 250% in the second quarter of 2022 as it breaks out of a widely-tracked, classic technical pattern. APE price “bull pennant” breakout underway On April 13, APE’s price broke above the upper trendline of what appears to be a “bull pennant” chart pattern. Bull pennants appear when the price consolidates inside a triangle-like structure following a strong uptrend. Many traditional analysts consider them as continuation patterns, for they typically result in the price breaking out in the direction of its previous trend. As a rule, traders estimate a bull pennant’s upside target by measuring the size of the previous uptrend, called “flagpole,” and adding it to the breakout point. Applying...
Ethereum price ‘bullish triangle’ puts 4-year highs vs. Bitcoin within reach
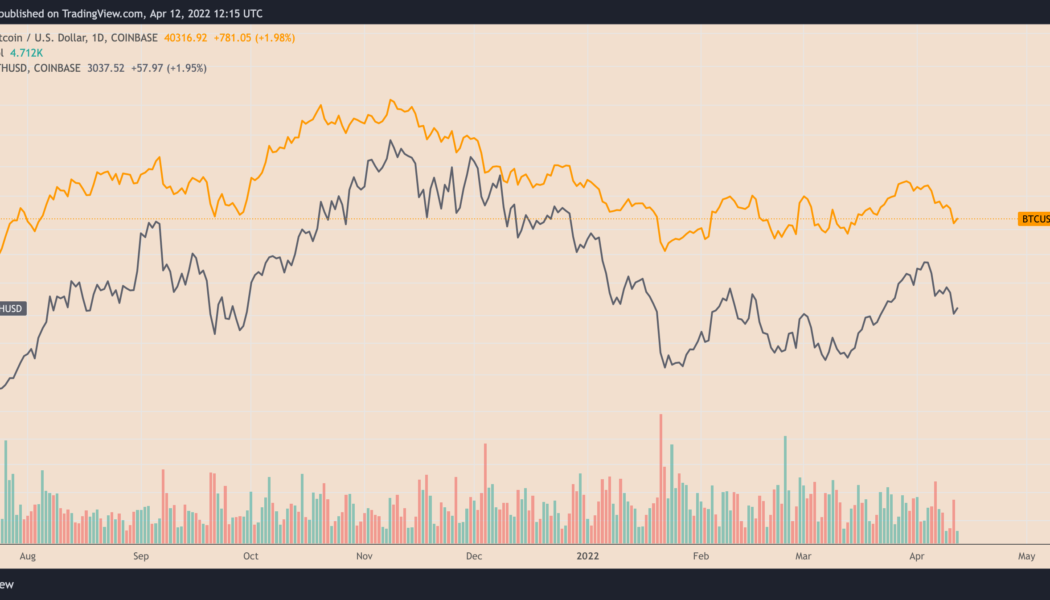
Ethereum’s native token Ether (ETH) has dropped about 17% against the U.S. dollar in the last two weeks. But its performance against Bitcoin (BTC) has been less painful with the ETH/BTC pair down 4.5% over the same period. The pair’s down-move appears as both ETH/USD and BTC/USD drop nearly in lockstep while reacting to the Federal Reserve’s potential to hike rates by 50 basis points and slash its balance sheet by $95 billion per month. The latest numbers released on April 12 show that consumer prices rose 8.5% in March, the most since 1981. BTC/USD vs. ETH/USD daily price chart. Source: TradingView ETH/BTC triangle breakout Several technicals remain bullish despite ETH/BTC dropping in the last two weeks. Based on a classic continuation pattern, the pair still l...
Terra price key support level breaks after 30% weekly drop — more pain for LUNA ahead?
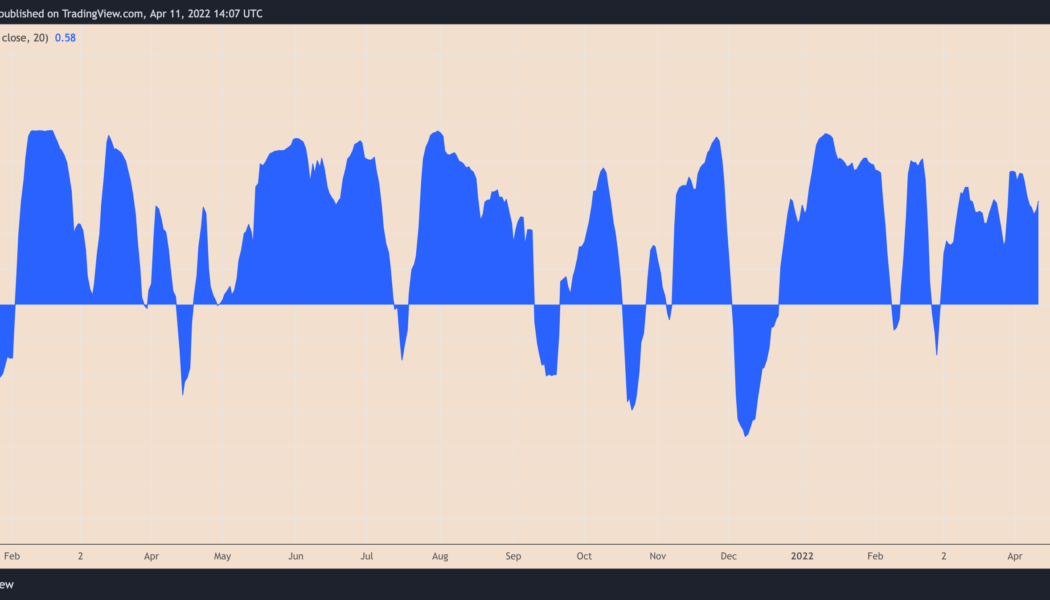
Terra (LUNA) price slid on April 11 as a broader correction across crypto assets added to the uncertainties concerning its token burning mechanism. Bitcoin (BTC) and Ether (ETH) led to a decline in the rest of the cryptocurrency market, with LUNA’s price dropping by over 8% to nearly $91.50, and about 30% from its record high of $120, set on April 6. The overall drop tailed similar moves in the U.S. stock market last week after the Federal Reserve signaled its intentions to raise interest rates and shrink balance sheets sharply to curb rising inflation. Arthur Hayes, the co-founder of BitMEX exchange, said Monday that Bitcoin’s correlation with tech stocks could have it run for $30,000 next. In other words, LUNA’s high correlation with BTC so far this year puts it at risk...
Monero defies crypto market slump with 10% XMR price rally — what’s next?
Privacy-focused cryptocurrency Monero (XMR) rallied by nearly 9.5% in the past week compared with the crypto market’s decline of 8.5% in the same period. What’s more, the XMR/USD pair has broken above a strong, multi-month resistance trendline, hinting at more upside ahead. XMR price action XMR’s price was down by a modest 0.87% on April 10 from its two-month-high of $245 established a day before. However, the cryptocurrency still outperformed its top rivals, including Bitcoin (BTC) and Ether (ETH), on a weekly timeframe. Speculations about entities using Monero to bypass sanctions could have boosted its appeal among investors. Meanwhile, The American research group Brookings warned last month that Monero, the first in the line of privacy coins, could...
Solana risks 35% price crash with SOL price chart ‘megaphone’ pattern
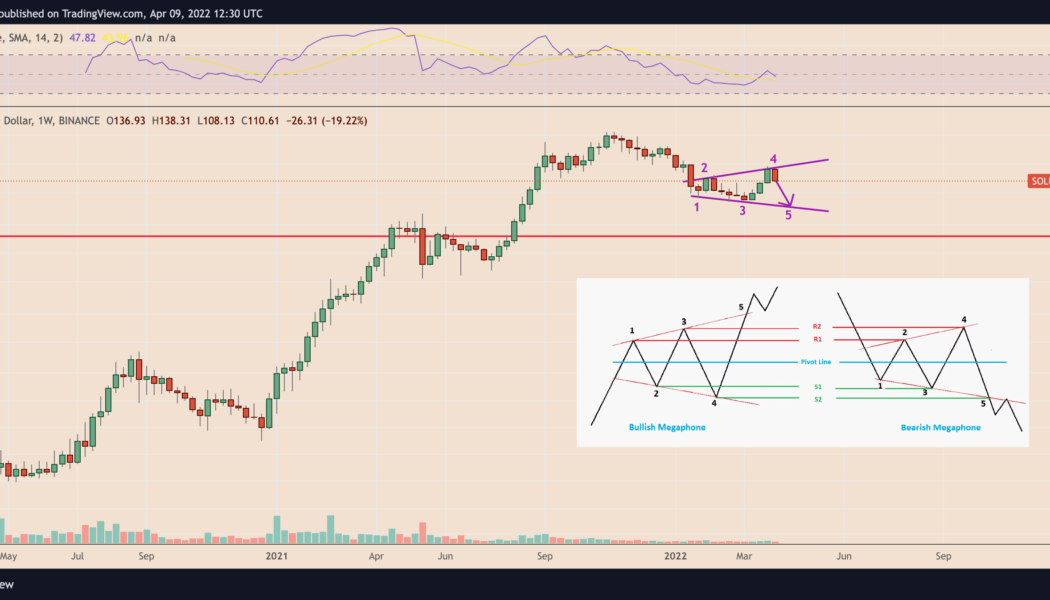
Solana (SOL) risks crashing 35% in the coming days as it comes closer to painting a so-called “megaphone” pattern. SOL price “megaphone” pattern In detail, megaphone setups consist of a minimum of lower lows and two higher highs and form during a period of high market volatility. But generally, these patterns consist of five consecutive swings, with the final one typically acting as a breakout signal. SOL has been sketching a similar pattern since the beginning of 2022, with the coin undergoing a pullback after testing the megaphone’s upper trendline near $140 as resistance — the fourth wing. As a result of the pattern, the Solana token could extend its decline to test the megaphone’s lower trendline as support near $65, about 35% below today’s pri...
3 reasons why Ethereum price can hit $4K in April
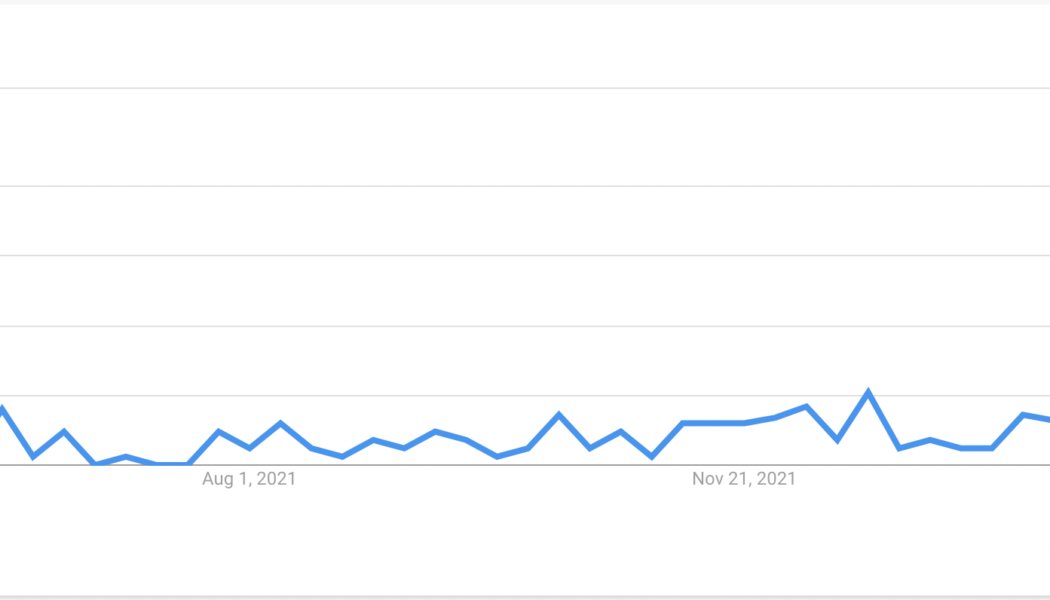
Three market catalysts suggest that Ethereum’s native token Ether (ETH) is well-positioned to reach $4,000 this month. Google searches for “Ethereum merge” spike Internet users’ interest in Ethereum’s upcoming network upgrade, dubbed “the Merge,” surged substantially in the week ending April 2, Google Trends’ data shows. Searches for the keyword “Ethereum Merge” reached a perfect Google Trends score of 100 on a 12-month timeframe with most traffic coming from the U.S., Singapore, Canada, and Australia. Internet trend score for the keyword ‘Ethereum Merge.’ Source: Google Trends Merge, also called ETH 2.0, refers to the Ethereum network’s full transition to Proof-of-Stake (PoS) from Proof-of-Work (PoW),...
Solana jumps past key selloff junction: SOL price eyes $150 in April
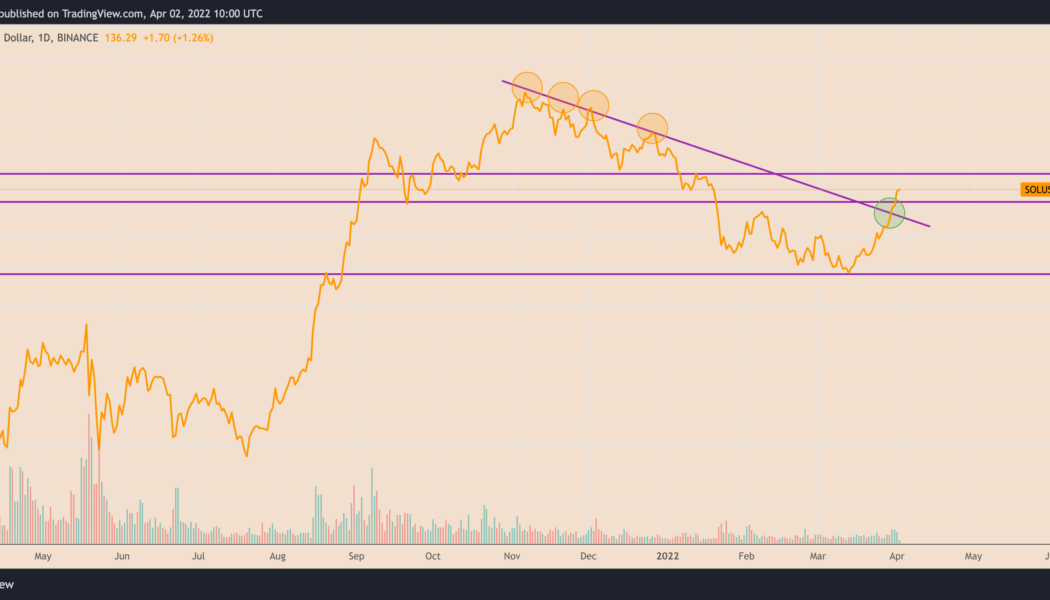
Solana (SOL) jumped past a critical resistance level that had limited its recovery attempts during the November 2021-March 2022 price correction multiple times, thus raising hopes of more upside in April. Solana flips key resistance to support To recap, SOL’s price underwent extreme pullbacks upon testing its multi-month downward sloping trendline in recent history. For instance, the SOL/USD pair dropped by 60% two months after retracing from the said resistance level in December 2021. Similarly, it had fallen by over 40% in a similar retracement move led by a selloff near the trendline in November 2021. SOL/USD daily price chart. Source: TradingView But Solana flipped the resistance trendline as support (S/R flip) after breaking above it on March 30, accompanied by a rise in trading...
