Technical Analysis
Ethereum price rises by 50% against Bitcoin in one month — but there’s a catch
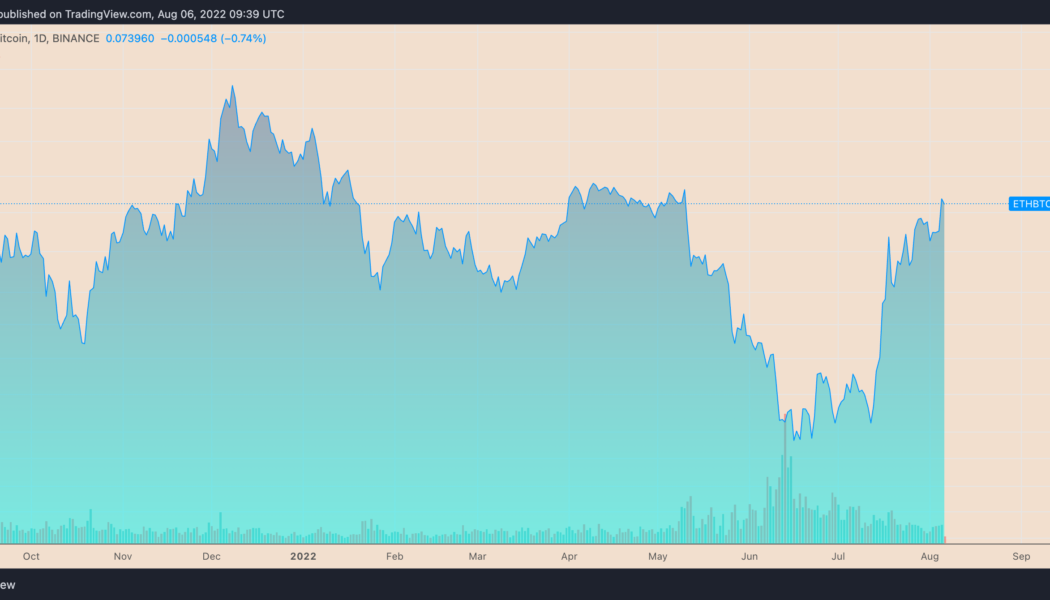
Ether (ETH), Ethereum’s native toke, has been continuing its uptrend against Bitcoin (BTC) as euphoria around its upcoming network upgrade, “the Merge,” grows. ETH at multi-month highs against BTC On the daily chart, ETH/BTC surged to an intraday high of 0.075 on Aug. 6, following a 1.5% upside move. Meanwhile, the pair’s gains came as a part of a broader rebound trend that started a month ago at 0.049, amounting to approximately 50% gains. ETH/BTC daily price chart. Source: TradingView The ETH/BTC recovery in part has surfaced due to the Merge, which will have Ethereum switch from proof-of-work (PoW) mining to proof-of-stake (PoS). Ethereum’s “rising wedge” suggests sell-off From a technical perspective, Ether stares at potential interim loss...
Will the Fed prevent BTC price from reaching $28K? — 5 things to know in Bitcoin this week
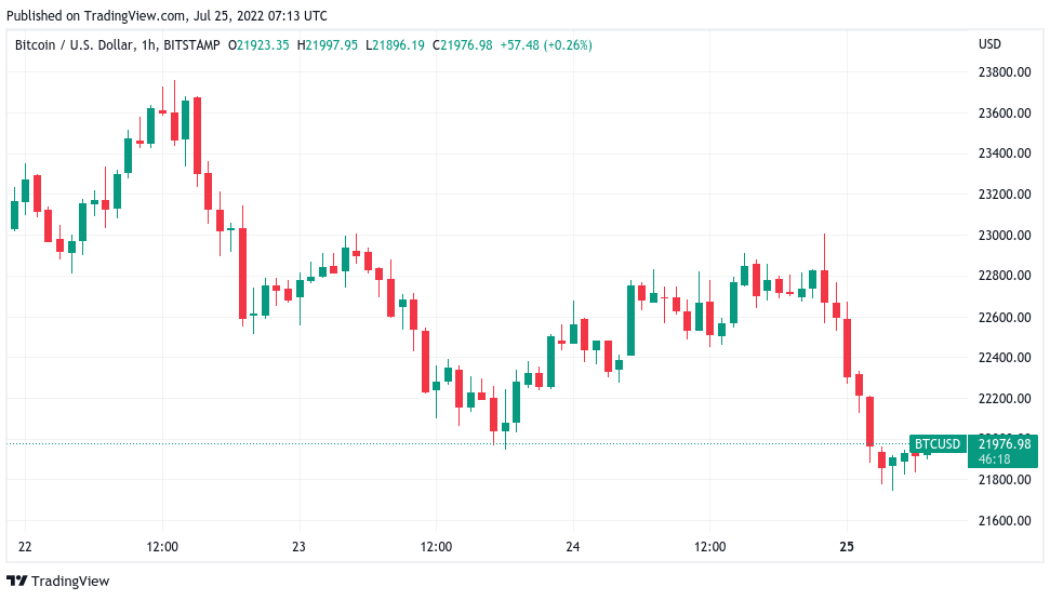
Bitcoin (BTC) enters a new week with a question mark over the fate of the market ahead of another key United States monetary policy decision. After sealing a successful weekly close — its highest since mid-June — BTC/USD is much more cautious as the Federal Reserve prepares to hike benchmark interest rates to fight inflation. While many hoped that the pair could exit its recent trading range and continue higher, the weight of the Fed is clearly visible as the week gets underway, adding pressure to an already fragile risk asset scene. That fragility is also showing in Bitcoin’s network fundamentals as miner strain becomes real and the true cost of mining through the bear market shows. At the same time, there are encouraging signs from some on-chain metrics, with long-term investors still re...
3 signs Bitcoin price is forming a potential ‘macro bottom’
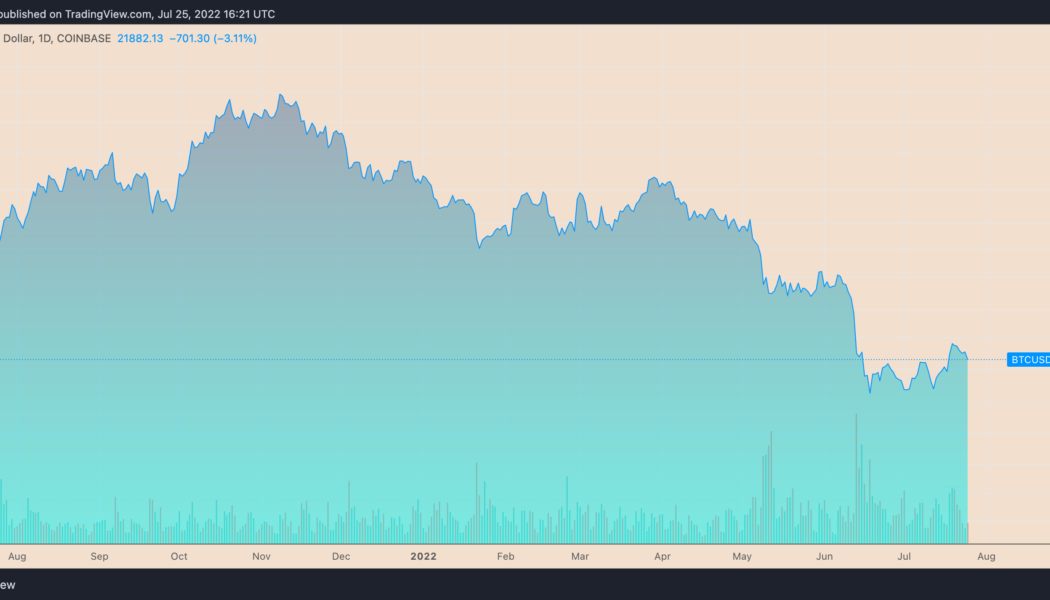
Bitcoin (BTC) could be in the process of bottoming after gaining 25%, based on several market signals. BTC’s price has rallied roughly 25% after dropping to around $17,500 on June 18. The upside retrace came after a 75% correction when measured from its November 2021 high of $69,000. BTC/USD daily price chart. Source: TradingView The recovery seems modest, however, and carries bearish continuation risks due to prevailing macroeconomic headwinds (rate hike, inflation, etc.) and the collapse of many high-profile crypto firms such as Three Arrows Capital, Terra and others. But some widely tracked indicators paint a different scenario, suggesting that Bitcoin’s downside prospects from current price levels are minimal. That big “oversold” bounce The...
Ethereum’s bearish U-turn? ETH price momentum fades after $1.6K rejection
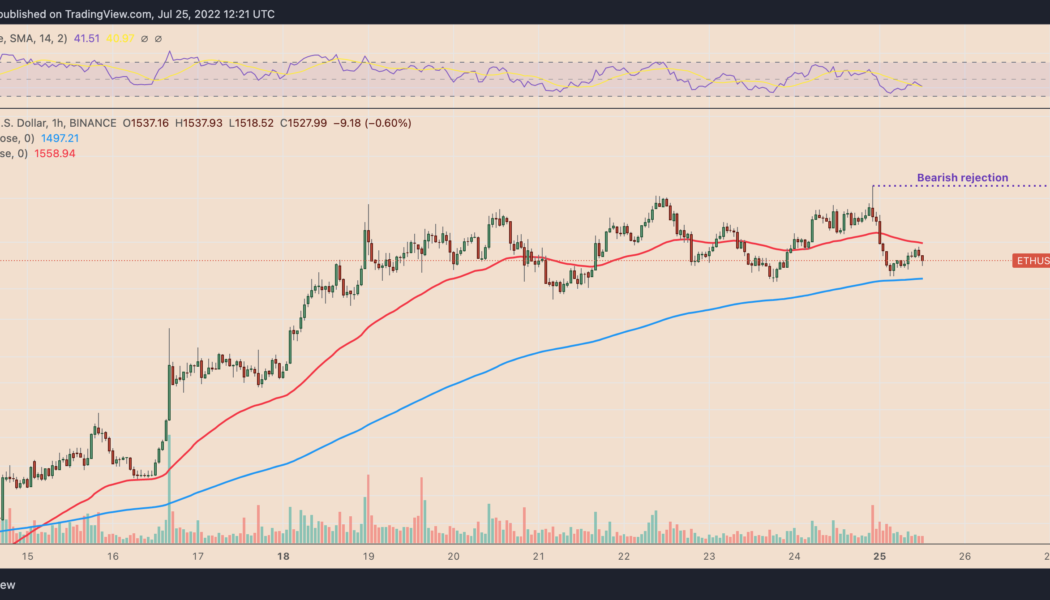
Ethereum’s native token Ether (ETH) tumbled on July 26, reducing hopes of an extended price recovery. The ETH/USD pair dropped by roughly 5%, followed by a modest rebound to over $1,550. Ethereum gets rejected at $1,650 These overnight moves liquidated over $80 million worth of Ether positions in the last 24 hours, data from CoinGlass reveals. ETH/USD hourly price chart. Source: TradingView The seesaw action also revealed an underlying bias conflict among traders who have been stuck between two extremely opposite market fundamentals. The first is the euphoria surrounding Ethereum’s potential transition to proof-of-stake in September, which has helped Ether’s price to recover 45% month-to-date. However, this bullish hype is at odds with macroeconomic headwinds, namel...
Ethereum price ‘cup and handle’ pattern hints at potential breakout versus Bitcoin
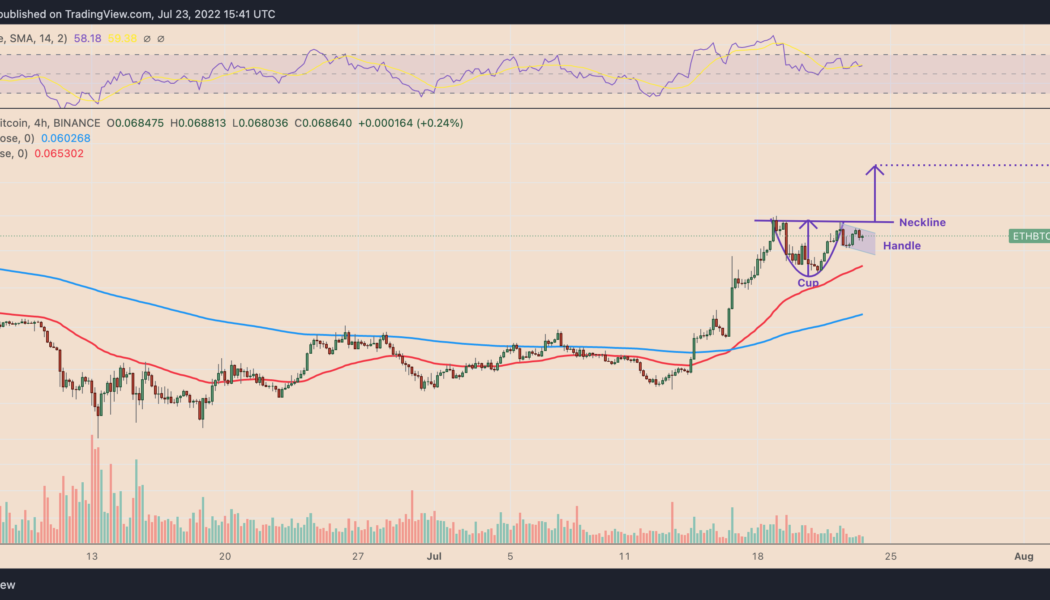
Ethereum’s native token Ether (ETH) has rebounded 40% against Bitcoin (BTC) after bottoming out locally at 0.049 on June 13. Now, the ETH/BTC pair is at two-month highs and can extend its rally in the coming weeks, according to a classic technical pattern. ETH paints cup and handle pattern Specifically, ETH/BTC has been forming a “cup and handle” on its lower-timeframe charts since July 18. A cup and handle setup typically appears when the price falls and then rebounds in what appears to be a U-shaped recovery, which looks like a “cup.” Meanwhile, the recovery leads to a pullback move, wherein the price trends lower inside a descending channel called the “handle.” The pattern resolves after the price rallies to an approximately equal size to ...
Coinbase stock has potential to double in 2022 after plunging 90% from record high
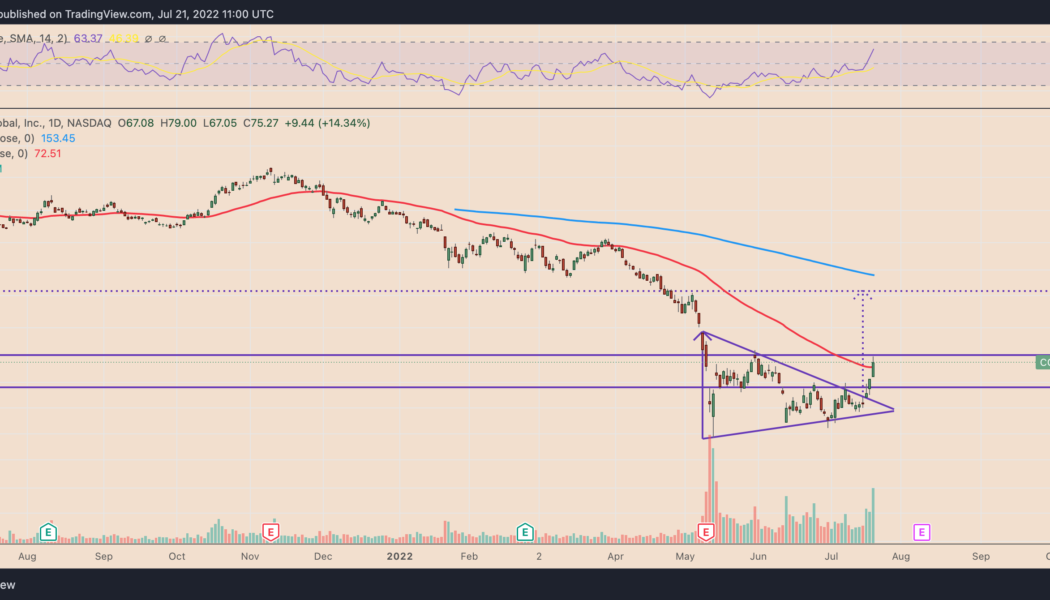
Coinbase stock (COIN) price has nearly doubled since its June lows with a potential for much more upside this year, according to a mix of technical and fundamental indicators. COIN’s symmetrical triangle reversal COIN has been undergoing a strong bullish reversal after falling by almost 90% from its record high of $368.90 in November 2021. Coinbase stock price was up over 95% to $75.27 as of July 20’s close when measured from its May 12 local bottom of $40.83. Its recovery led to a symmetrical triangle pattern formation with the price forming a sequence of lower highs and higher lows. Symmetrical triangles in downtrend typically turn out to be bearish continuation patterns. They resolve after the price breaks below their lower trendlines to fall further. But in rare instances, ...
Bitcoin’s inverse correlation with US dollar hits 17-month highs — what’s next for BTC?
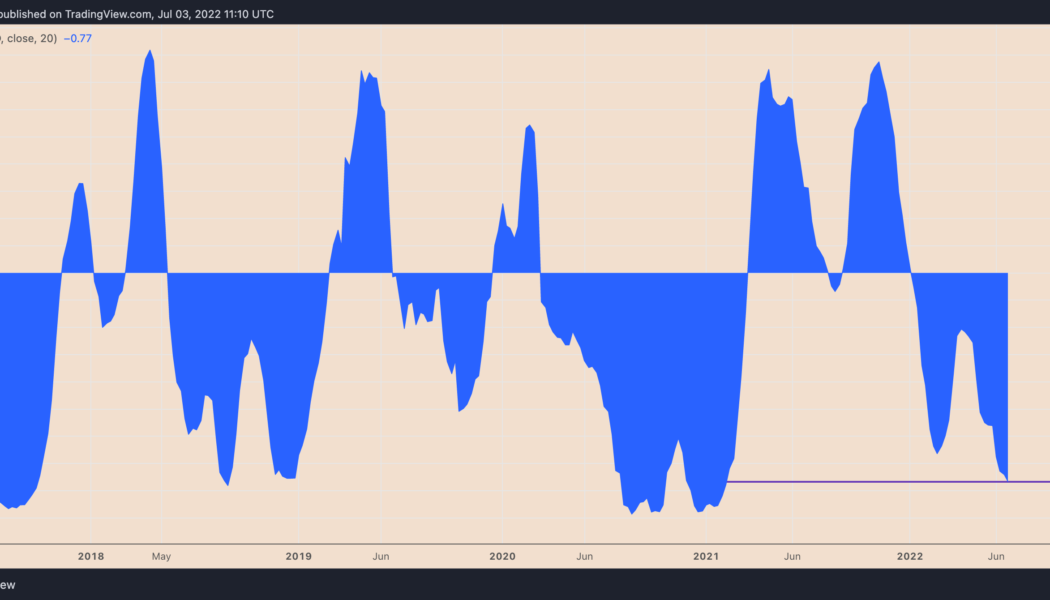
Bitcoin (BTC) has been moving in the opposite direction of the U.S. dollar since the beginning of 2022 — and now that inverse relationship is more extreme than ever. Bitcoin and the dollar go in opposite ways Notably, the weekly correlation coefficient between BTC and the dollar dropped to 0.77 below zero in the week ending July 3, its lowest in seventeen months. Meanwhile, Bitcoin’s correlation with the tech-heavy Nasdaq Composite reached 0.78 above zero in the same weekly session, data from TradingView shows. BTC/USD and U.S. dollar correlation coefficient. Source: TradingView That is primarily because of these markets’ year-to-date performances amid the fears of recession, led by the Federal Reserve’s benchmark rate hikes to curb rising inflation. Bitcoin, for example,...
Can Cardano’s July hard fork prevent ADA price from plunging 60%?
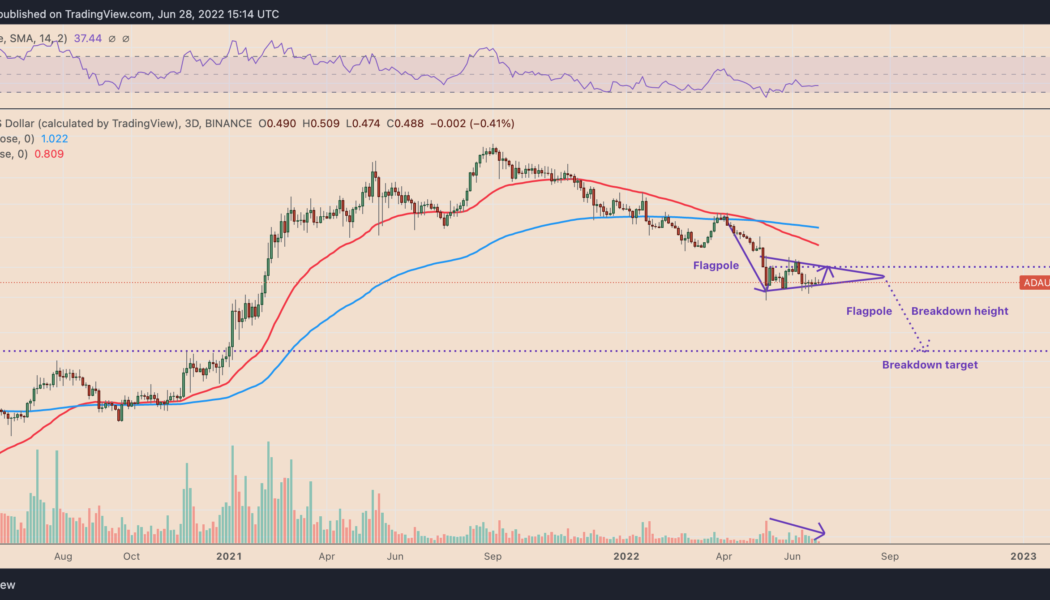
Cardano (ADA) has started painting a bearish continuation pattern on its longer-timeframe charts, raising its likelihood of undergoing a major price crash by August. ADA price in danger of a 60% plunge Dubbed the “bear pennant,” the pattern forms when the price consolidates inside a range defined by a falling trendline resistance and rising trendline support after a strong move downside. Additionally, the consolidation moves accompany a decrease in trading volumes. Bear pennants typically resolve after the price breaks below their trendline support and, as a rule, could fall by as much as the height of the previous big downtrend, called a “flagpole,” as illustrated in the chart below. ADA/USD three-day price chart featuring “bear pennant'”setup. So...
Terra’s LUNA2 skyrockets 70% in nine days despite persistent sell-off risks
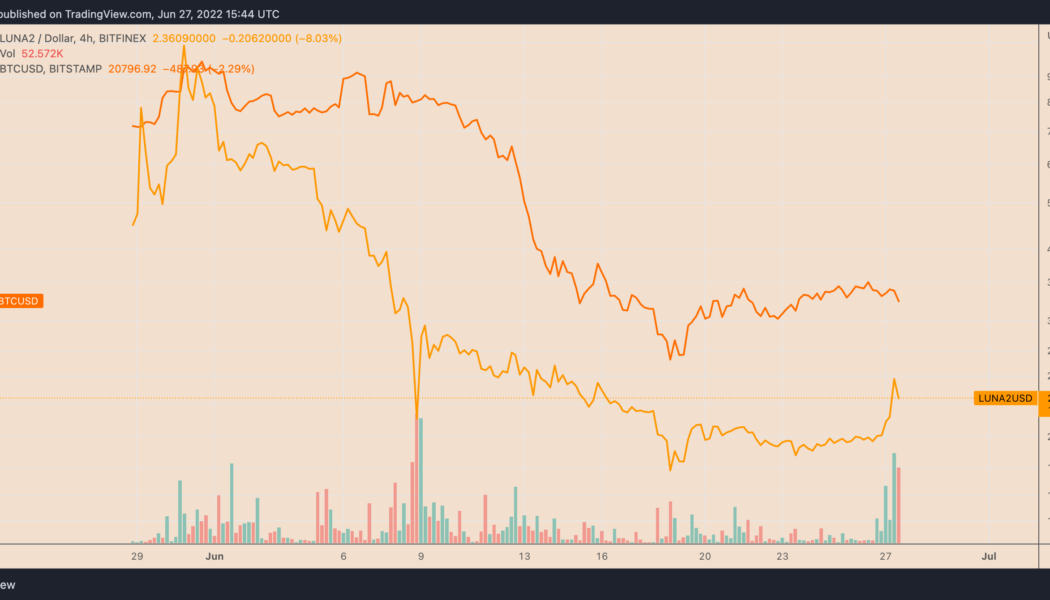
The price of Terra (LUNA2) has recovered sharply nine days after falling to its historic lows of $1.62. On June 27, LUNA2’s rate reached $2.77 per token, thus chalking up a 70% recovery when measured from the said low. Still, the token traded 77.35% lower than its record high of $12.24, set on May 30. LUNA2’s recovery mirrored similar retracement moves elsewhere in the crypto industry with top crypto assets Bitcoin (BTC) and Ether (ETH) rising by approximately 25% and 45% in the same period. LUNA2/USD four-hour price chart versus BTC/USD. Source: TradingView LUNA2 price rally could trap bulls The recent bout of buying in the LUNA2 market could trap bulls, given it has come as a part of a broader correction trend. In detail, LUNA2 appears to be forming a “bear flag&#...
Ethereum price enters ‘oversold’ zone for the first time since November 2018
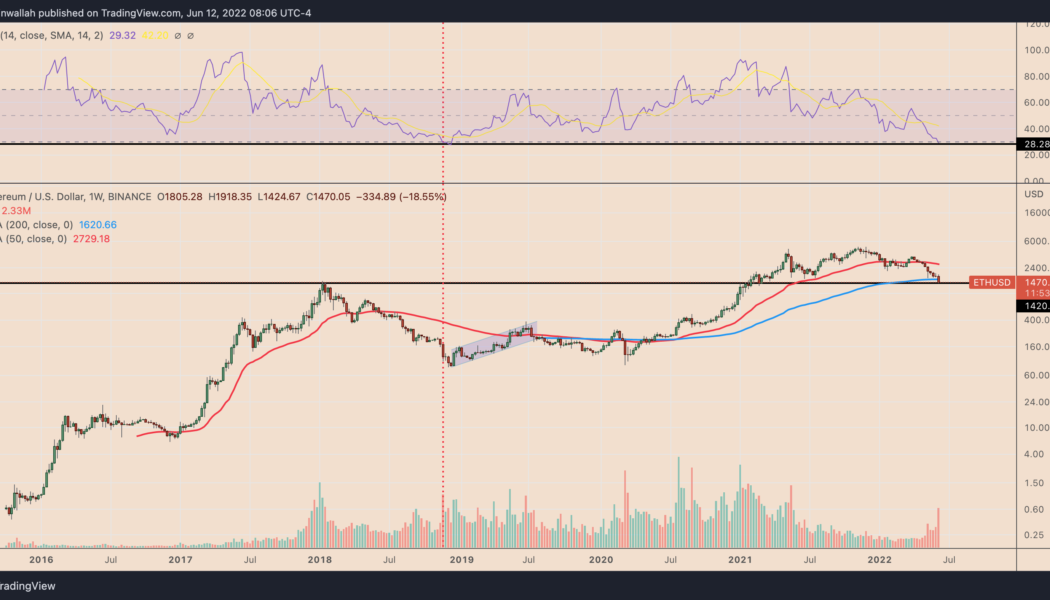
Ethereum’s native token Ether (ETH) entered its “oversold” territory this June 12, for the first time since November 2018, according to its weekly relative strength index (RSI). This is the last time $ETH went oversold on the weekly (hasn’t confirmed here yet). I had no followers, but macro bottom ticked it. Note, you can push way lower on weekly rsi, not trying to catch a bottom. https://t.co/kLCynTKTcS — The Wolf Of All Streets (@scottmelker) June 12, 2022 ETH eyes oversold bounce Traditional analysts consider an asset to be excessively sold after its RSI reading fall below 30. Furthermore, they also see the drop as an opportunity to “buy the dip,” believing an oversold signal would lead to a trend reversal. Ether’s previous oversold reading appeared i...
Solana price just one breakdown away from a 40% slide in June — here’s why
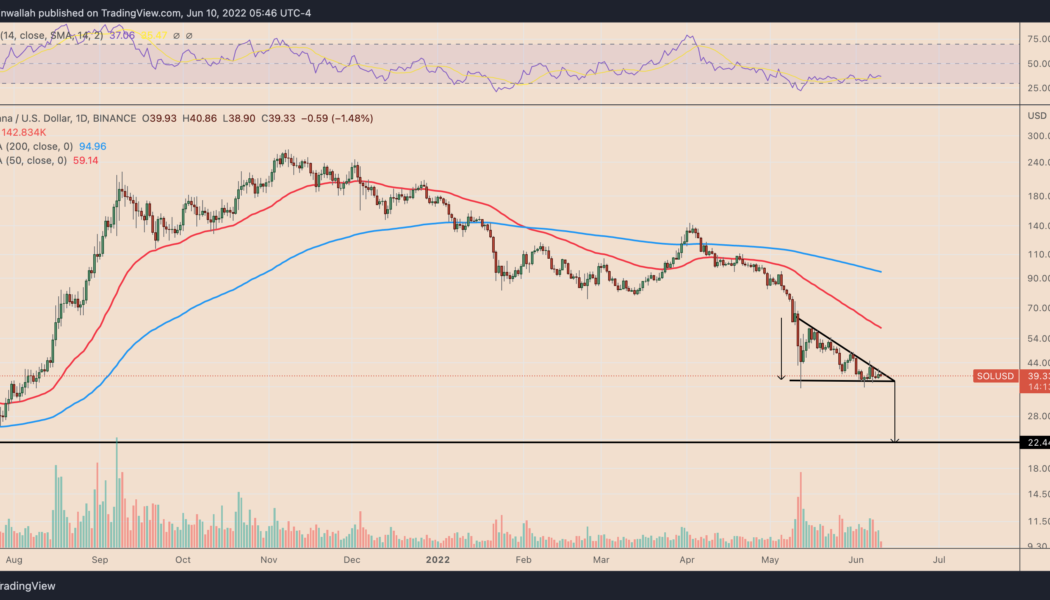
Solana (SOL) is nearing a decisive breakdown moment as it inches towards the apex of its prevailing “descending triangle” pattern. SOL’s 40% price decline setup Notably, SOL’s price has been consolidating inside a range defined by a falling trendline resistance and horizontal trendline support, which appears like a descending triangle—a trend continuation pattern. Therefore, since SOL has been trending lower, down about 85% from its November 2021 peak of $267, its likelihood of breaking below the triangle range is higher. As a rule of technical analysis, a breakdown move followed by the formation of a descending triangle could last until the price has fallen by as much as the triangle’s maximum height. This puts SOL’s bearish price target at $22.50 ...
BNB price risks 40% drop as SEC launches probe against Binance
Binance Coin (BNB) price dropped by nearly 7.3% on June 7 to below $275, its lowest level in three weeks. What’s more, BNB price could drop by another 25%–40% in 2022 as its parent firm, Binance, faces allegations of breaking securities rules and laundering billions of dollars in illicit funds for criminals. Bad news twice in a row BNB was issued as a part of an initial coin offering (ICO) in 2017 that amassed $15 million for Binance. The token mainly behaves as a utility asset within the Binance ecosystem, primarily enabling traders to earn discounts on their trading activities. Simultaneously, BNB also functions as a speculative financial asset, which has made it the fifth-largest cryptocurrency by market capitalization. BNB market capitalization was $45.42 billion as of June ...
