Tech Analysis
Why is there so much uncertainty in the crypto market right now? | Market Talks with Crypto Jebb and Crypto Wendy O
In the fourth episode of Market Talks, we welcome YouTube media creator and crypto educator Crypto Wendy O. Crypto Wendy O is a YouTube media creator and crypto educator. Wendy became interested in cryptocurrency and blockchain technology in November of 2017. She has been into crypto full-time since the summer of 2018 and focuses on providing transparent marketing & media solutions for blockchain companies globally. Wendy also provides free education via YouTube and Twitter to her growing audience of over 170 thousand, giving her the largest following of any female crypto influencer in the world. Some of the topics up for discussion with Wendy are the new consumer price index (CPI) numbers and how they might impact the crypto market going forward, and why there is so much uncertai...
STEPN rebounds sharply after falling 80% in a month — is GMT price bottoming out?
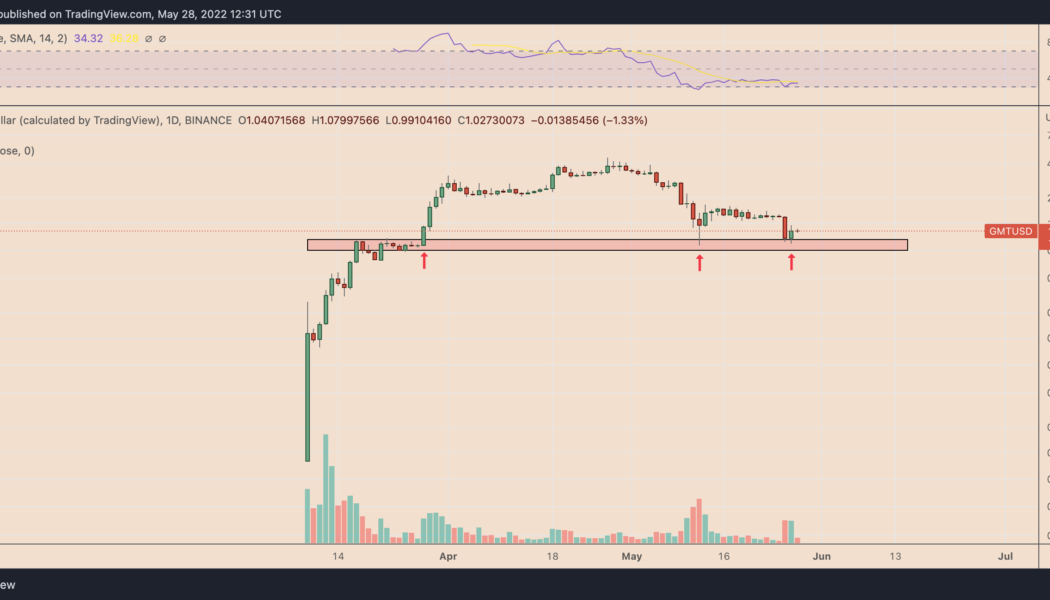
A massive downtrend in the STEPN (GMT) prices witnessed in the last 30 days appears to be nearing exhaustion. GMT’s price has rebounded by nearly 35%—from $0.80 on May 27 to $0.99 on May 28. Interestingly, the upside retracement started after the price fell in the same range, which had acted as support before GMT’s 500% and 120% price rallies in March and early May, respectively. GMT/USD daily price chart. Source: TradingView Additionally, the rebound further preceded an 80% drop from its record high of $4.50, established on April 27, which left GMT oversold, per its daily relative strength index reading that slipped below the oversold threshold of 30 on May 26. The technical support, in addition to oversold RSI, suggests GMT is in the process of bottoming out. GMT price levels...
Bitcoin transaction fees hit decade lows, here’s why
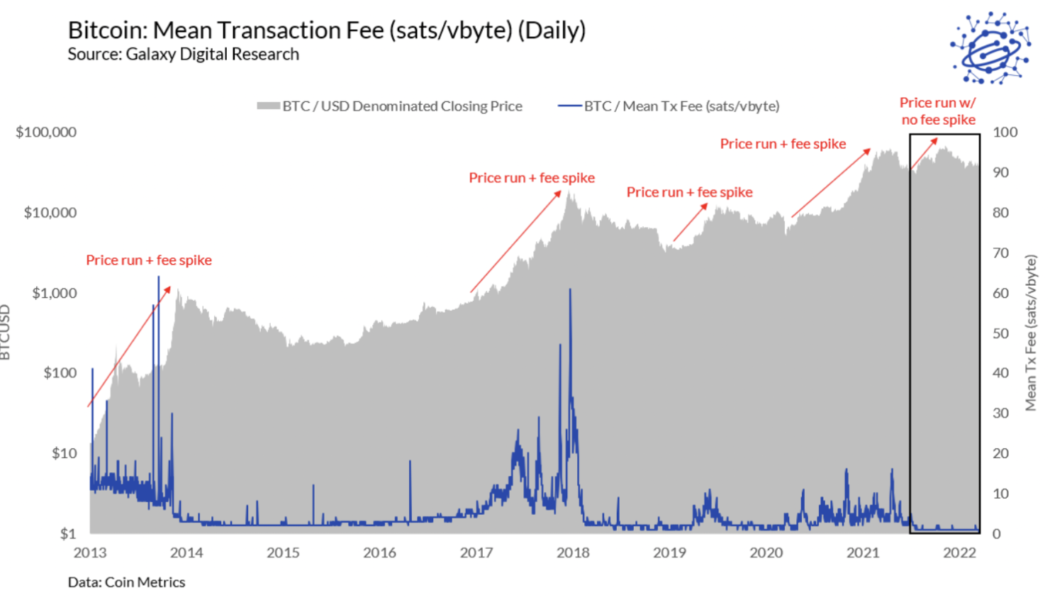
It’s a great time to move Bitcoin (BTC) between wallets and exchanges. Bitcoin transaction fees have hit all-time lows in BTC, according to research by Galaxy Digital. #bitcoin fees are at all-time lows. the craziest thing? fall 2021 was the first bull run not accompanied by a major spike in fees. how is that possible? what does it mean? here’s a thread explaining the most confounding (and awesome) chart in bitcoin. (remember june 2021) pic.twitter.com/gnWssTckX2 — Alex Thorn (@intangiblecoins) April 5, 2022 As shown on the graph below, the Bitcoin mean transaction fee has plummeted to 0.00004541 Bitcoin ($2.06) in 2022, while the median is 0.00001292 Bitcoin ($0.59) which is the lowest of any year except 2011, according to the report. Graph to show the fees trending down ...
Avalanche price rallies 20% after report reveals $25M inflows into AVAX investment vehicles
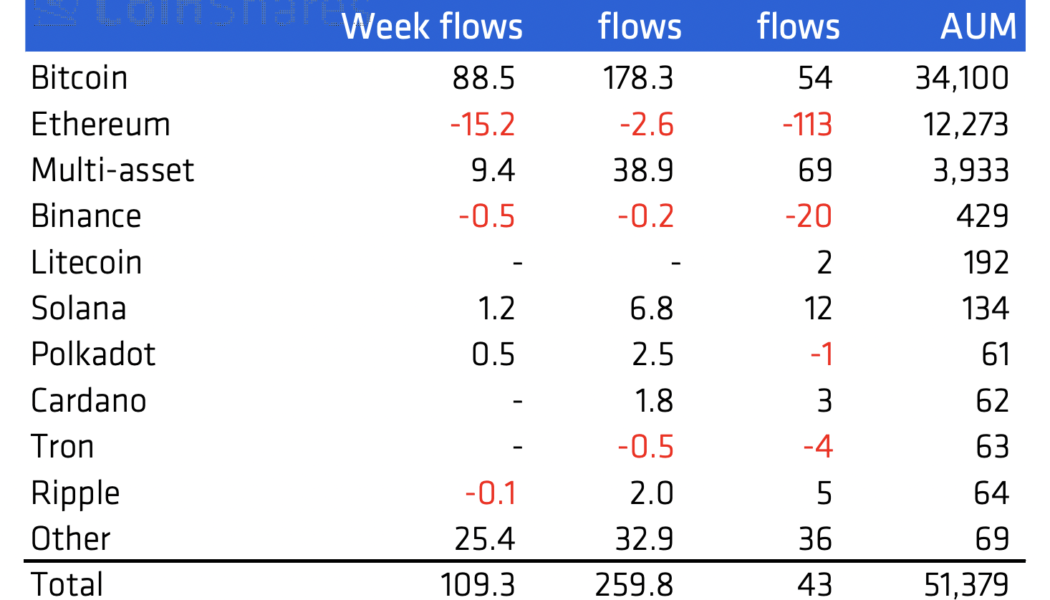
Avalanche (AVAX) rallied by around 20% in the last two days as a new report revealed millions of dollars flowing into AVAX-based investment products. Penned by CoinShares, an institutional crypto fund manager, the report highlighted that Avalanche-based investment vehicles attracted about $25 million in the week ending Feb. 21, the second-biggest inflow recorded in the said period after Bitcoin’s (BTC) $89 million. Flow of assets. Source: Bloomberg, CoinShares In contrast, Ether (ETH), Avalanche’s top rival in the smart contracts sector, witnessed an outflow totaling $15 million. On the whole, Avalanche and similar cryptocurrency investment products attracted around $109 million, recording their fifth week of positive inflows in a row. AVAX rebounds against macro headwinds...
Ethereum to $10K? Classic bullish reversal pattern hints at potential ETH price rally
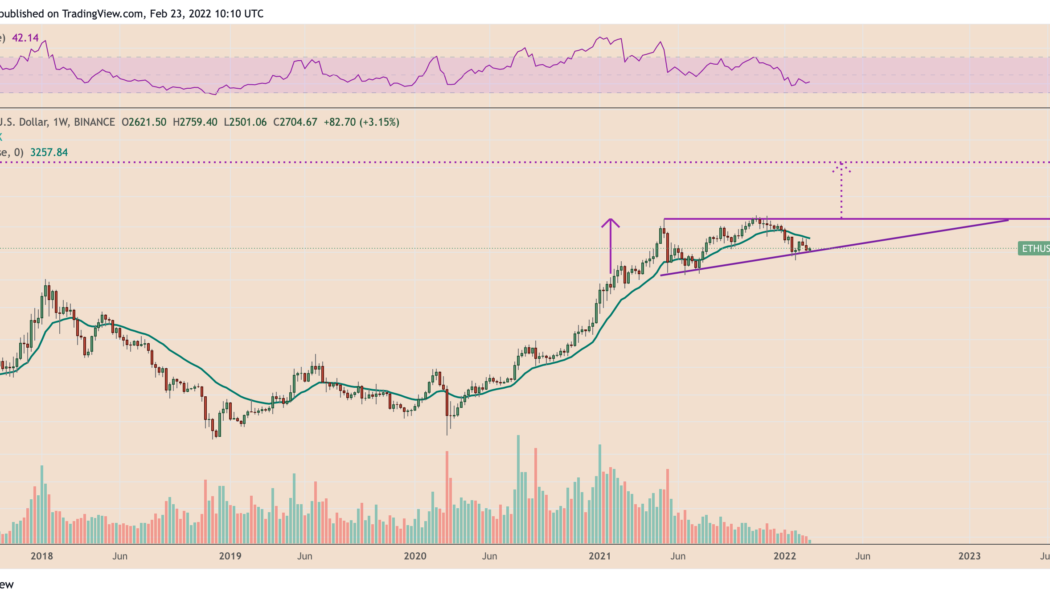
Ethereum’s native token, Ether (ETH), could reach above $10,000 in the coming weeks as it paints what appears to be an “ascending triangle” technical pattern. Ether’s price technicals: Bullish signs Ascending triangles are bullish continuation setups that appear during an uptrend. Analysts confirm their presence after the price rises upward inside a rising right-angle triangle structure, thus forming a sequence of lower highs on the lower trendline with resistance in place at the upper one. As the pattern develops, volumes typically drop. So far, Ether has been forming a similar upside pattern on its weekly chart. In detail, the triangle’s lower trendline has been acting as an accumulation range since the beginning of 2021, with high selling pressure at the upper trendline, as shown b...
Terra’s Mirror Protocol shows first signs of bottoming after price gains 30% in 48 hours
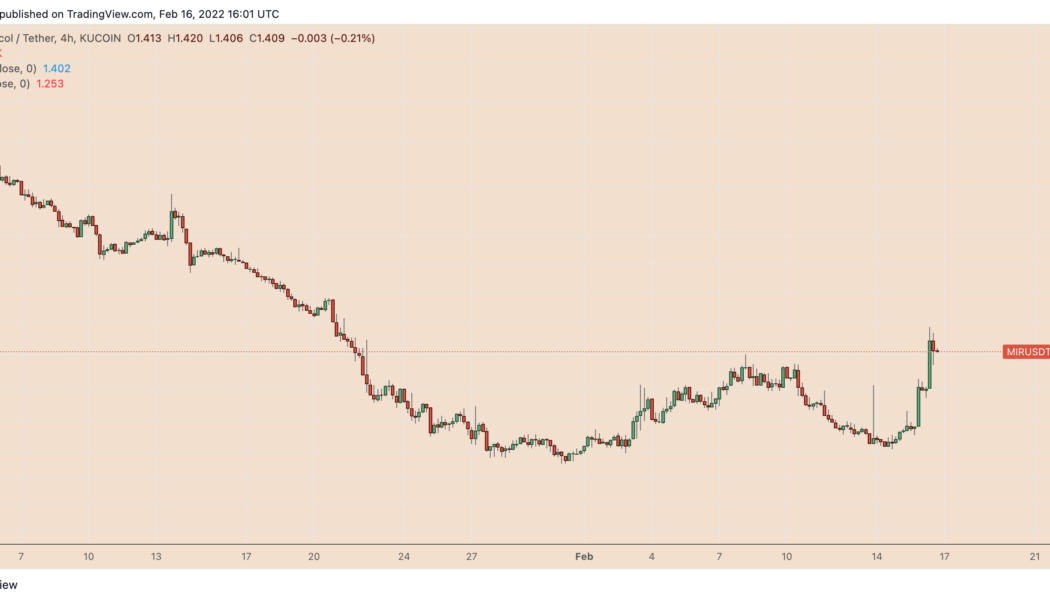
Mirror Protocol, a decentralized finance (DeFi) protocol built atop the Terra blockchain, was among the biggest gainers in the last 48 hours, primarily as its native token MIR rallied by over 30% to $1.48, its highest level since Jan. 22. MIR/USD four-hour price chart. Source: TradingView Has Mirror Protocol bottomed out? MIR price rose despite an absence of concrete fundamentals, a sight pretty common across crypto assets. As a result, its rally may have been purely technically-driven, especially because it originated after MIR had dropped by more than 90% in value from its May 2021 high near $13, making the token extremely oversold. IncomeSharks, an independent market analyst, called MIR’s rebound move a “no brainer,” noting that its multi-month drop had left ...
Bearish chart pattern hints at $70 Solana (SOL) price before a possible oversold bounce
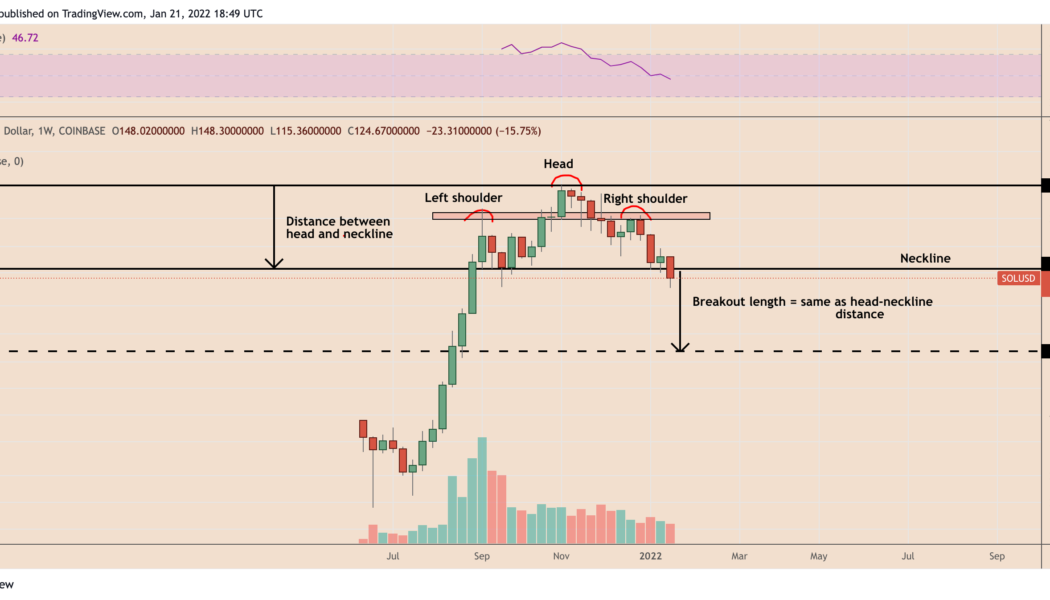
Solana (SOL) price may fall to $70 a token in the coming weeks as a head and shoulders setup emerged on the daily timeframe and possibly points toward a 45%+ decline. The chart below shows that SOL price rallied to nearly $217 in September 2021, dropped to a support level near $134 and then moved to establish a new record high of $260 in November 2021. Earlier this week, the price fell back to test the same $134-support level before breaking to a 2022 low at $87.73. SOL/USD weekly price chart featuring head and shoulders setup. Source: TradingView This phase of price action appears to have formed a head and shoulders setup, a bearish reversal pattern containing three consecutive peaks, with the middle one around $257 (called the “head”) coming out to be higher than the oth...
- 1
- 2


