Tapering
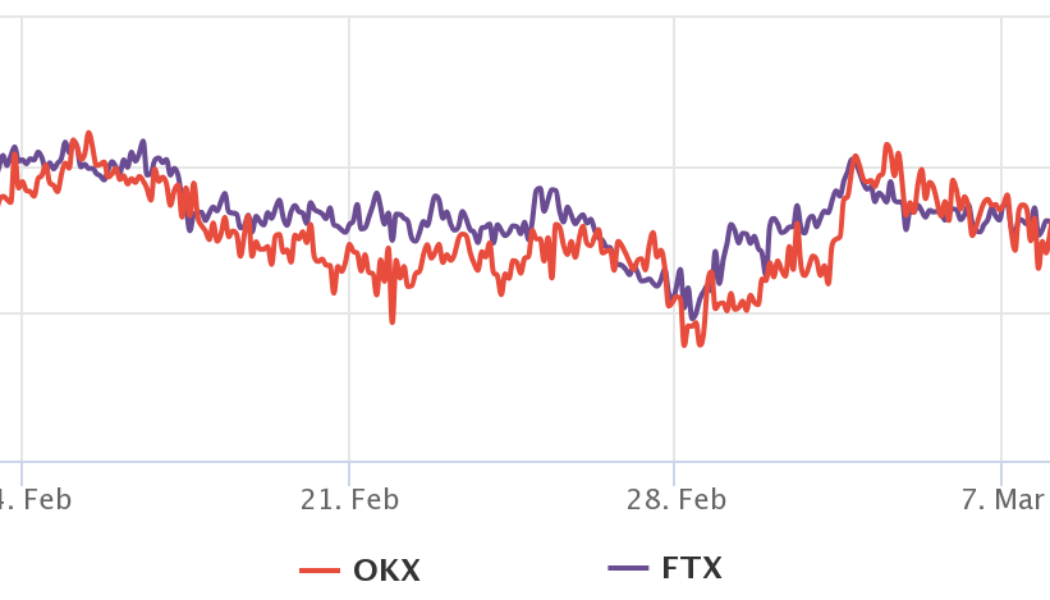

Bitcoin derivatives metrics reflect traders’ neutral sentiment, but anything can happen
Bitcoin’s (BTC) last daily close above $45,000 was 66 days ago, but more importantly, the current $39,300 level was first seen on Jan. 7, 2021. The 13 months of boom and bust cycles culminated with BTC price hitting $69,000 on Nov. 10, 2021. It all started with the VanEck spot Bitcoin exchange-traded fund being rejected by the United States Securities and Exchange Commission (SEC) on Nov. 12, 2020. Even though the decision was largely expected, the regulator was harsh and direct on the rationale backing the denial. Curiously, nearly one year later, on Nov. 10, 2021, cryptocurrency markets rallied to an all-time high market capitalization at $3.11 trillion right as U.S. inflation as measured by the CPI index hit 6.2%, a 30-year high. Inflation also had negative consequences on risk ma...
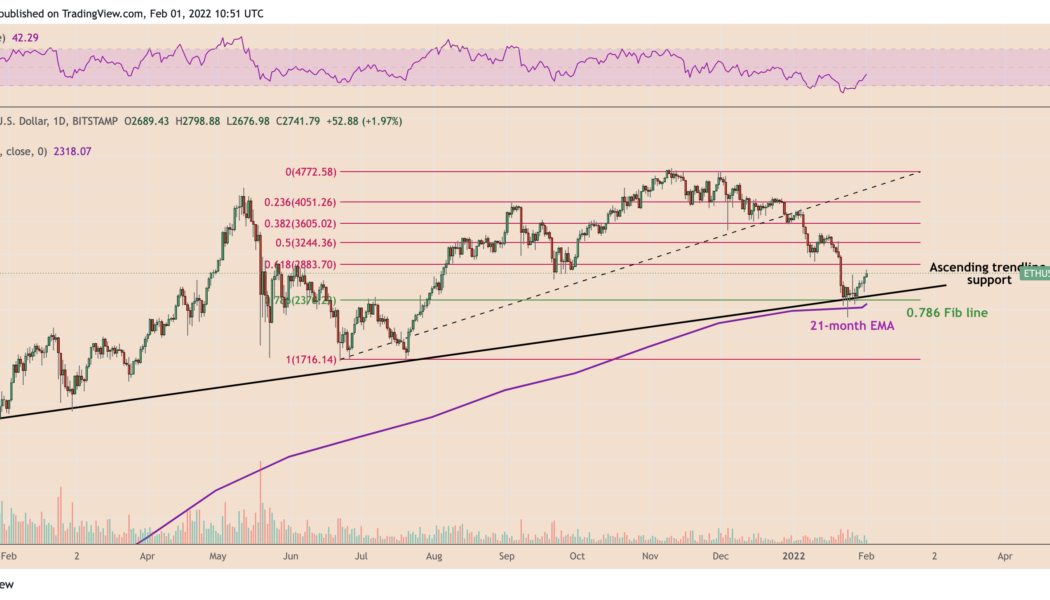

Can Ethereum price reach $4K after a triple-support bounce?
Ethereum’s native token Ether (ETH) looks ready to continue its ongoing rebound move toward $4,000, according to a technical setup shared by independent market analyst Wolf. Classic bullish reversal pattern in the works? The pseudonymous chart analyst discussed the role of at least three support levels in pushing the ETH price up by nearly 30% from its local bottom of $2,160. These price floors included a 21-month exponential moving average, the 0.786 Fib level of a Fibonacci retracement graph drawn from $1,716-swing low to $4,772-swing high, and the lower boundary of an ascending triangle pattern. ETH/USD daily price chart featuring the three-supports. Source: TradingView Wolf noted that the triple-support scenario could push Ether price to $3,330. In doing so, ...
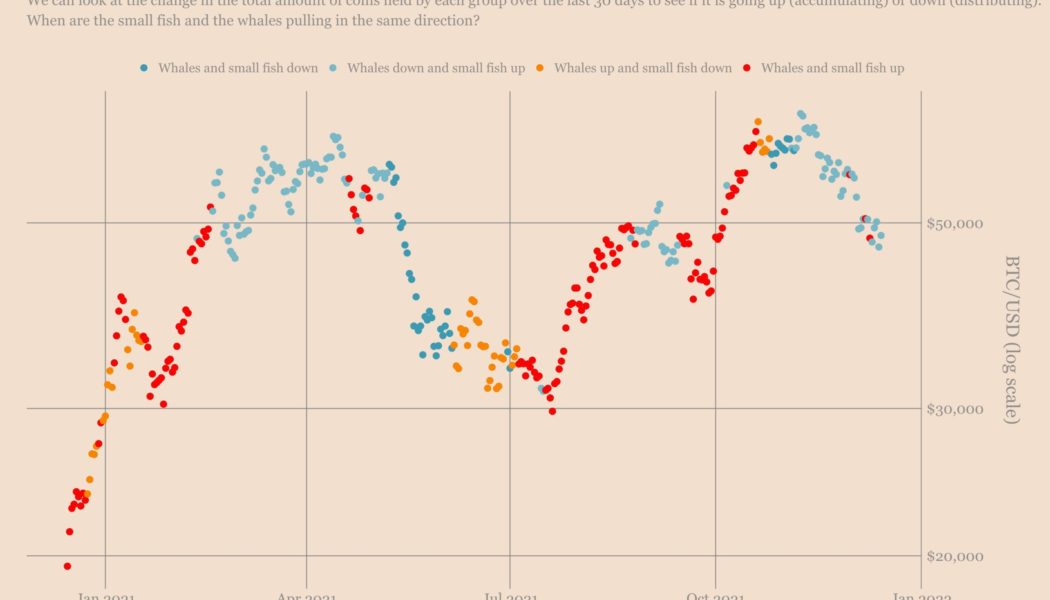

Fish food? Data shows retail investors are buying Bitcoin, whales are selling
Bitcoin (BTC) staged an impressive recovery after dropping to its three-month low of $42,333 on Dec. 4, rising to as high as $51,000 since. The BTC price retracement primarily surfaced due to increased buying activity among addresses that hold less than 1 BTC. In contrast, the Bitcoin wallets with balances between 1,000 BTC and 10,000 BTC did little in supporting the upside move, data collected by Ecoinometrics showed. “Bitcoin is still stuck in a situation where small addresses are willing to stack sats [the smallest unit account of Bitcoin], while the whale addresses aren’t really accumulating,” the crypto-focused newsletter noted after assessing the change in Bitcoin amounts across small and rich wallet groups, as shown in the graph below. Bitcoin on-chain ...

Data suggests traders view $46,000 as Bitcoin’s final line in the sand
Dec. 13 will likely be remembered as a “bloody Monday” after Bitcoin (BTC) price lost the $47,000 support, and altcoin prices dropped by as much as 25% within a matter of moments. When the move occurred, analysts quickly reasoned that Bitcoin’s 8.5% correction was directly connected to the Federal Open Market Committee (FOMC) meeting, which starts on Dec. 15. Investors are afraid that the Federal Reserve will eventually start tapering, which simply put, is a reduction of the Federal Reserve’s bond repurchasing program. The logic is that a revision of the current monetary policy would negatively impact riskier assets. While there’s no way to ascertain such a hypothesis, Bitcoin had a 67% year-to-date gain until Dec. 12. Therefore, it makes sense for investors to pocket those profits a...
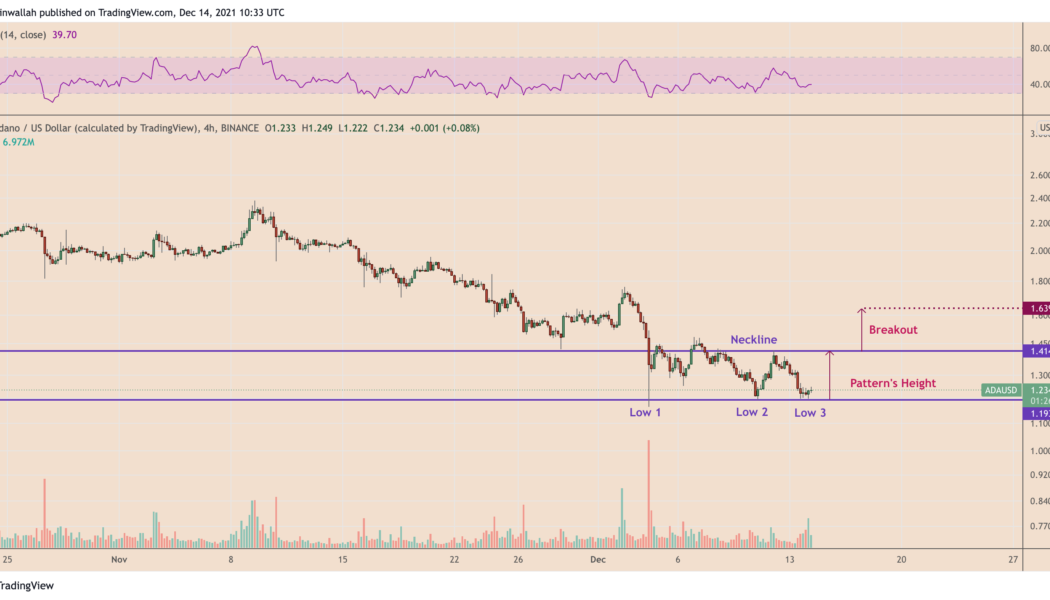

Cardano’s ADA price eyes 30% rally with a potential ‘triple bottom’ setup
Cardano (ADA) may rally by nearly 30% in the coming days as it forms a classic bullish reversal pattern. Sharp ADA rebound underway Dubbed “triple bottom,” the pattern typically occurs at the end of a downtrend and consists of three consecutive lows printed roughly atop the same level. This means triple bottoms indicate sellers’ inability to break below a specific support level on three back-to-back attempts, which ultimately paves the way for buyers to take over. In a perfect scenario, the return of buyers to the market allows the instrument to retrace sharply toward a higher level, called the “neckline,” that connects the highs of the previous two rebounds. The move follows up with another breakout, this time taking the price higher by as much as the distance between the pattern’s bottom...


3 reasons why Ethereum price can drop below $3K by the end of 2021
Ethereum’s native token Ether (ETH) reached an all-time high around $4,867 earlier in November, only to plunge by nearly 20% a month later on rising profit-taking sentiment. And now, as the ETH price holds $4,000 as a key support level, risks of further selloffs are emerging in the form of multiple technical and fundamental indicators. ETH price rising wedge First, Ether appears to have been breaking out of “rising wedge,” a bearish reversal pattern that emerges when the price trends upward inside a range defined by two ascending — but converging — trendlines. Simply put, as the Ether price nears the Wedge’s apex point, it risks breaking below the pattern’s lower trendline, a move that many technical chartists see as a cue for more losses ahead. In doing so, t...