S&P 500
Price analysis 1/17: SPX, DXY, BTC, ETH, BNB, XRP, DOGE, ADA, MATIC, DOT
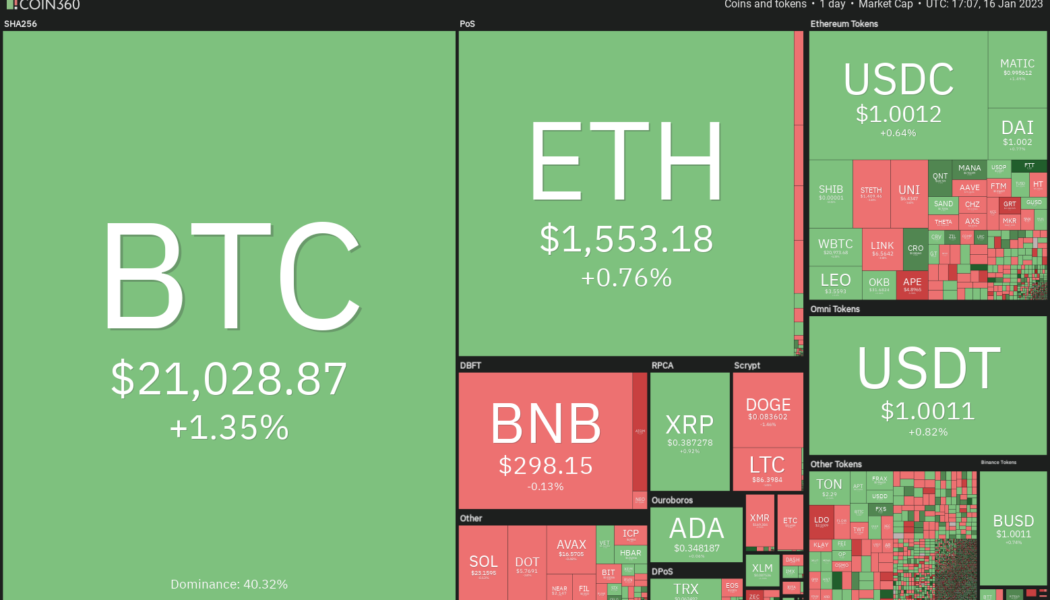
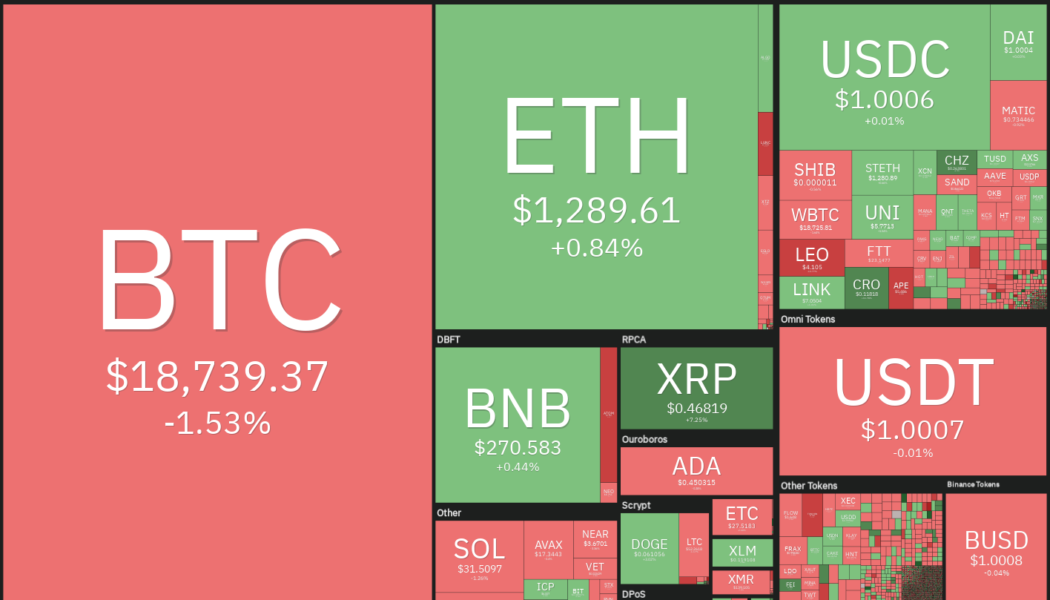
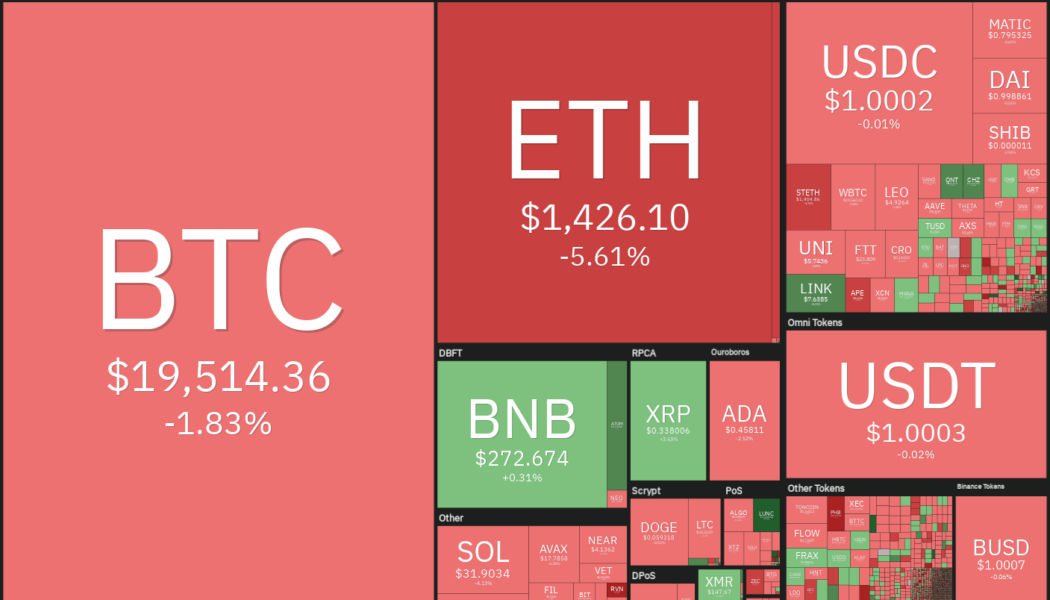
Risk assets have started the new year on a strong note. The S&P 500 (SPX) and the Nasdaq closed in the positive for the second successive week and also notched their best weekly performance since November. Bitcoin (BTC) led the recovery in the crypto markets with a sharp 21% rally last week. That sent the Bitcoin Fear and Greed Index into the neutral territory of 52 on Jan. 15, its highest since April 5, 2022. However, the index has given back its gains and is again back into the Fear zone on Jan. 17. Daily cryptocurrency market performance. Source: Coin360 The strong rally in Bitcoin has divided analysts’ opinions. While some expect the rally to be a bull trap, others believe that the up-move could be the start of a new bull market. The confirmation of the same will happen...
Price analysis 10/21: SPX, DXY, BTC, ETH, BNB, XRP, ADA, SOL, DOGE, MATIC
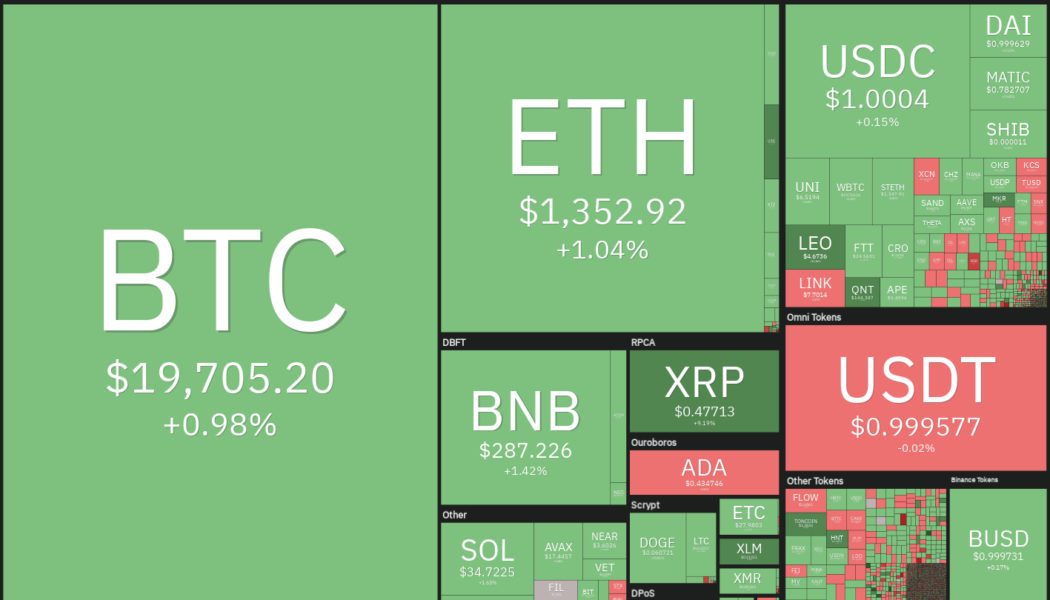
The 10-year Treasury yield in the United States rose to its highest level since 2008. Although this type of rally is usually negative for risky assets, the U.S. stock markets recovered ground after the Wall Street Journal reported that some officials of the Federal Reserve were concerned about the pace of the rate hikes and the risks of over-tightening. While it is widely accepted that the U.S. will enter a recession, a debate rages on about how long it could last. On that, Tesla CEO Elon Musk recently said on Twitter that the recession could last “probably until spring of ‘24,” and added that it would be nice to spend “one year without a horrible global event.” Daily cryptocurrency market performance. Source: Coin360 Bitcoin’s (BTC) price has witnessed a massive drop from its all-time hig...
Price analysis 10/14: SPX, DXY, BTC, ETH, BNB, XRP, ADA, SOL, DOGE, MATIC
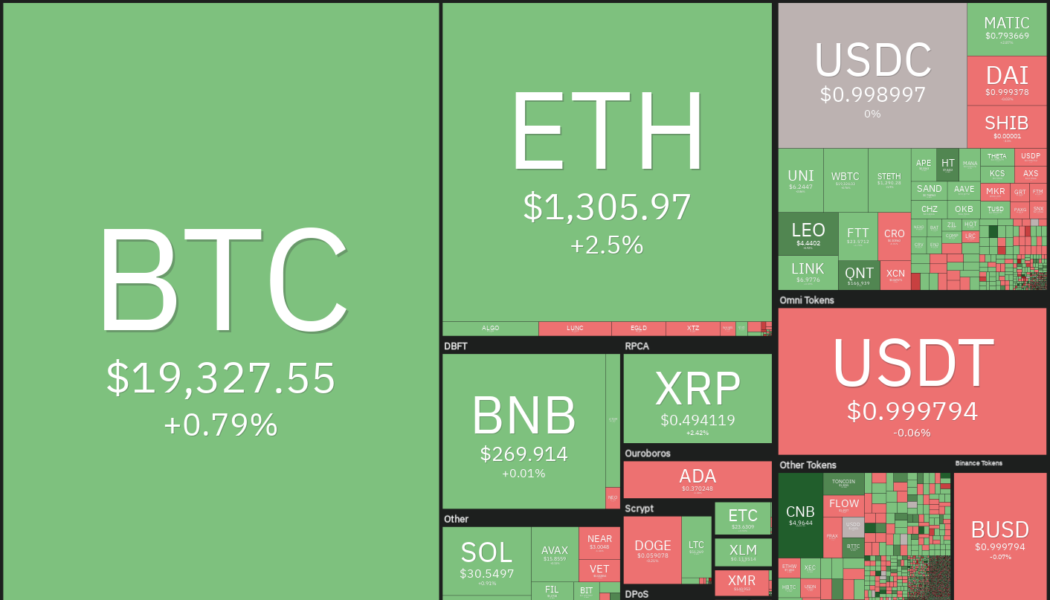
The United States Consumer Price Index (CPI) increased 8.2% annually in September, beating economists’ expectations of an 8.1% rise. The CPI print lived up to its hype and caused a sharp, but short-term increase in volatile risk assets. The S&P 500 oscillated inside its widest trading range since 2020 and Bitcoin (BTC) also witnessed a large intraday range of more than $1,323 on Oct. 13. However, Bitcoin still could not shake out of the $18,125 to $20,500 range in which it has been for the past several days. Daily cryptocurrency market performance. Source: Coin360 Both the U.S. equities markets and Bitcoin tried to extend their recovery on Oct. 14 but the higher levels attracted selling, indicating that the bears have not yet given up. Could the increased volatility culminate wit...
Price analysis 9/30: SPX, DXY, BTC, ETH, BNB, XRP, ADA, SOL, DOGE, DOT
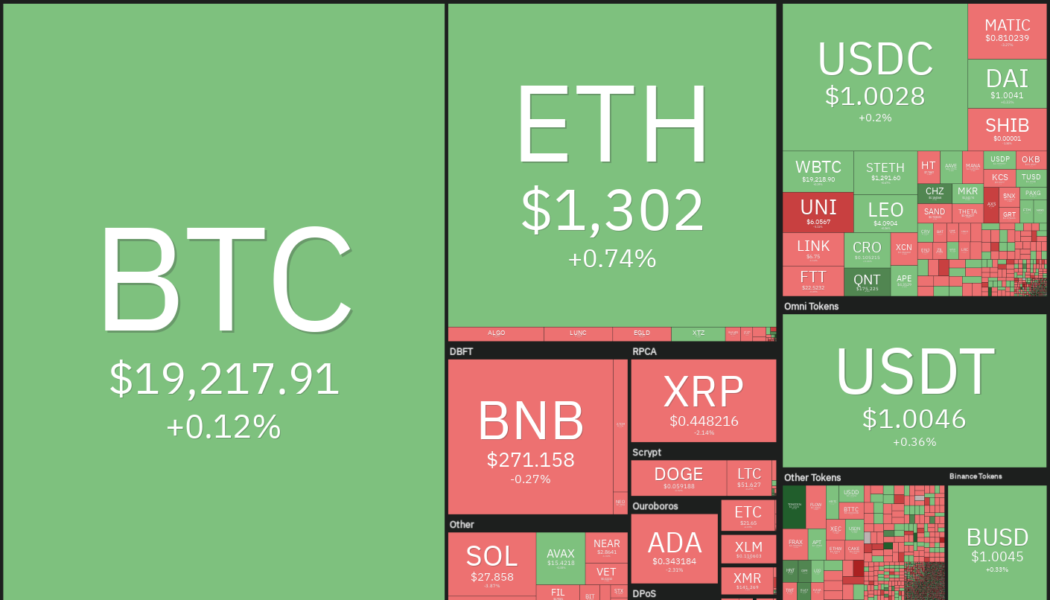
The United States equities markets have been under a firm bear grip for a large part of the year. The S&P 500 and the Nasdaq Composite have declined for three quarters in a row, a first since 2009. There was no respite in selling in September and the Dow Jones Industrial Average is on track to record its worst September since 2002. These figures outline the kind of carnage that exists in the equities market. Compared to these disappointing figures, Bitcoin (BTC) and select altcoins have not given up much ground in September. This is the first sign that selling could be drying up at lower levels and long-term investors may have started bottom fishing. Daily cryptocurrency market performance. Source: Coin360 In the final quarter of the year, investors will continue to focus on the inflat...
Price analysis 9/23: SPX, DXY, BTC, ETH, BNB, XRP, ADA, SOL, DOGE, DOT
The S&P 500 index has declined about 5% this week while the Nasdaq Composite is down more than 5.5%. Investors fear that the Federal Reserve’s aggressive rate hikes could cause an economic downturn. The yield curve between the two-year and 10-year Treasury notes, which is watched closely by analysts for predicting a recession, has inverted the most since the year 2000. Among all the mayhem, it is encouraging to see that Bitcoin (BTC) has outperformed both the major indexes and has fallen less than 4% in the week. Could this be a sign that Bitcoin’s bottom may be close by? Daily cryptocurrency market performance. Source: Coin360 On-chain data shows that the amount of Bitcoin supply held by long-term holders in losses reached about 30%, which is 2% to 5% below the level that coinci...
Price analysis 9/16: SPX, DXY, BTC, ETH, BNB, XRP, ADA, SOL, DOGE, DOT
The World Bank has warned of a possible global recession in 2023. In a press release on Sept. 15, the bank said that the current pace of rate hikes and policy decisions is unlikely to be enough to bring inflation down to pre-pandemic levels. Ray Dalio, the billionaire founder of Bridgewater Associates said in a blog post on Sept. 13 that if rates were to rise to about 4.5% in the United States, it would “produce about a 20 percent negative impact on equity prices.” The negative outlook for the equity markets does not bode well for the cryptocurrency markets as both have been closely correlated in 2022. Daily cryptocurrency market performance. Source: Coin360 The macroeconomic developments seem to be worrying cryptocurrency investors who sent 236,000 Bitcoin (BTC) to major cryptocurren...
Why September is shaping up to be a potentially ugly month for Bitcoin price
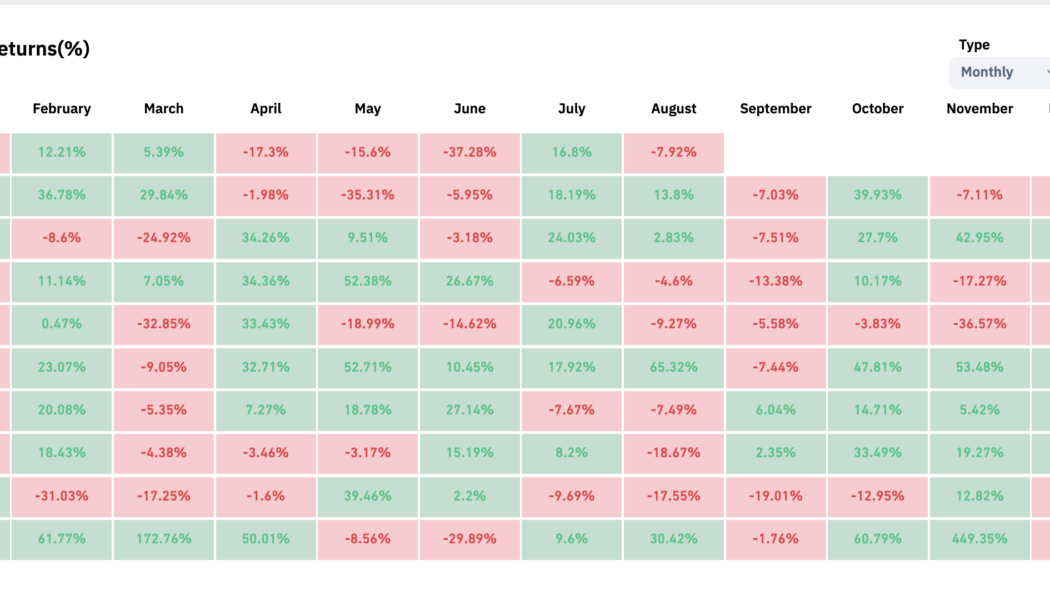
Bitcoin (BTC) bulls should not get excited about the recovery from the June lows of $17,500 just yet as BTC heads into its riskiest month in the coming days. The psychology behind the “September effect” Historic data shows September being Bitcoin’s worst month between 2013 and 2021, except in 2015 and 2016. At the same time, the average Bitcoin price decline in the month is a modest -6%. Bitcoin monthly returns. Source: CoinGlass Interestingly, Bitcoin’s poor track record across the previous September months coincides with similar downturns in the stock market. For instance, the average decline of the U.S. benchmark S&P 500 in September is 0.7% in the last 25 years. S&P 500 performance in August and September since 1998. Source: Bloomberg Traditional chart a...
Solana (SOL) price is poised for a potential 95% crash — Here’s why
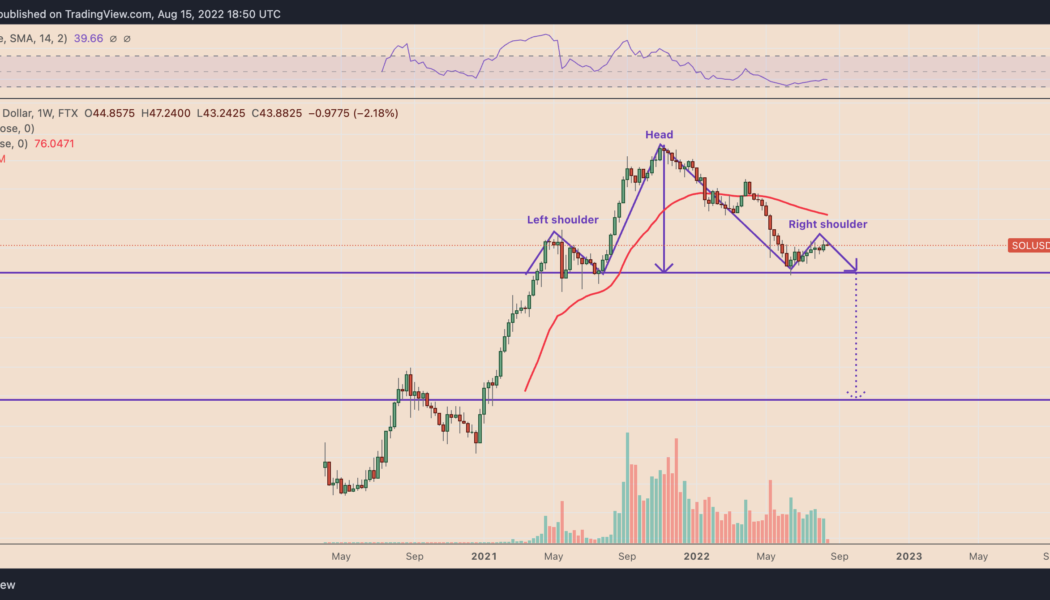
Solana (SOL) price rallied by approximately 75% two months after bottoming out locally near $25.75, but the token’s splendid upside move is at risk of a complete wipeout due to an ominous bearish technical indicator. A major SOL crash setup surfaces Dubbed a “head-and-shoulders (H&S),” the pattern appears when the price forms three consecutive peaks atop a common resistance level (called the neckline). Notably, the middle peak (head) comes to be higher than the other two shoulders, which are of almost equal height. Head and shoulders patterns resolve after the price breaks below their neckline. In doing so, the price falls by as much as the distance between the head’s peak and the neckline when measured from the breakdown point, per a rule of technical analysis....
Bitcoin ends week ‘on the edge’ as S&P 500 officially enters bear market
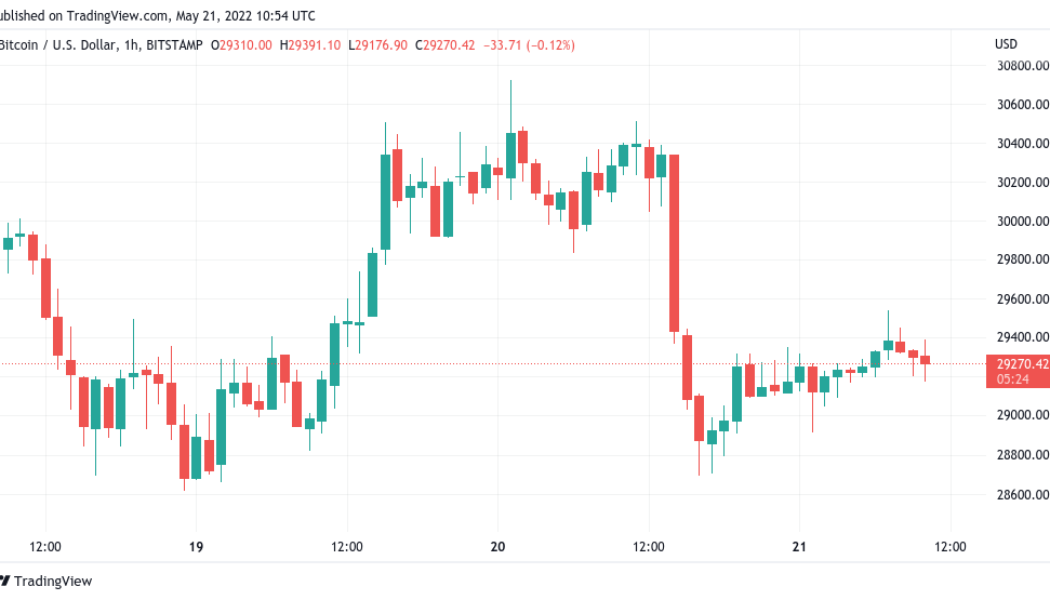
Bitcoin (BTC) struggled to recover its latest losses on May 21 after Wall Street trading provided zero respite. BTC/USD 1-hour candle chart (Bitstamp). Source: TradingView BTC price reflects drab stocks performance Data from Cointelegraph Markets Pro and TradingView showed BTC/USD trading at dipping below $28,700 into the weekend, subsequently adding around $500. Down 4.7% from the previous day’s $30,700 highs, the pair looked firmly rangebound at the time of writing after United States stocks indices saw a volatile final trading day of the week. The S&P 500, managed to reverse after initially falling at the open, nonetheless confirmed bear market tendencies, trading at 20% below its highs from last year. The S&P 500 has officially entered a bear market pic.twitter.com/N...
Bitcoin rebounds over $41K after painting a ‘bullish hammer’ — Can BTC hit $64K next?
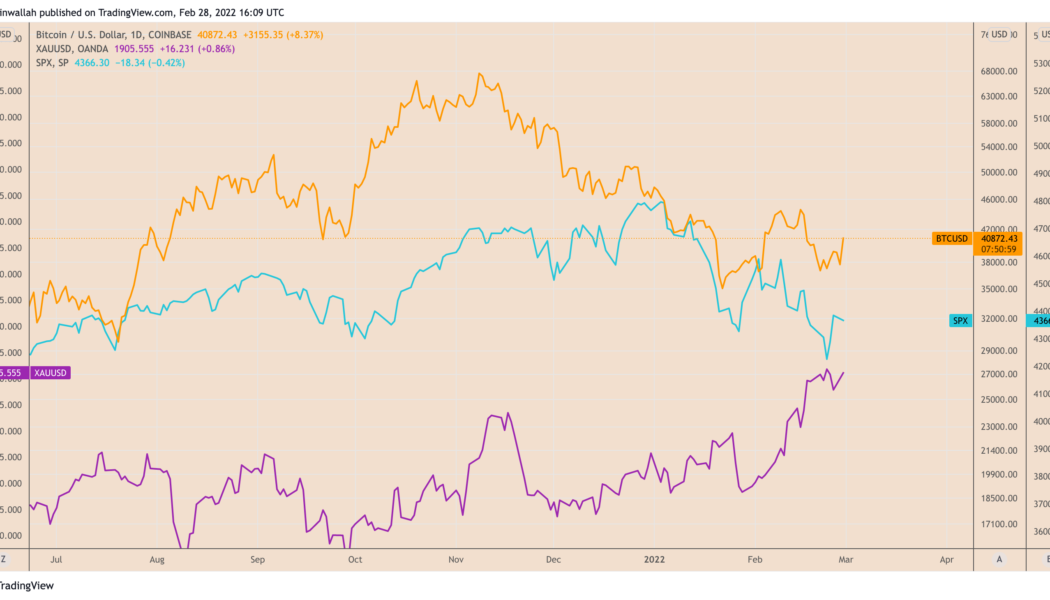
Bitcoin (BTC) rallied above $41,000 on Feb. 28 in a new sign of buying sentiment returning after last week’s brutal selloff across the risk-on markets, including the S&P 500. BTC’s price jumped by over 9% to reach $41,300, in part, as traders reacted to the ongoing development in the Russia-Ukraine crisis. In doing so, the cryptocurrency briefly broke its correlation with the U.S. stock market indexes to perform more like safe-haven gold, whose price also went higher in early trading on Feb. 28. BTC/USD versus XAUUSD and S&P 500 daily price chart. Source: TradingView Bitcoin downtrend exhausting — analyst Johal Miles, an independent market analyst, spotted “significant buying pressure” in the market, adding that its downtrend might be heading towards exhaust...
Solana’s weekend bounce risks turning into a bull trap — Can SOL price fall to $60 next?
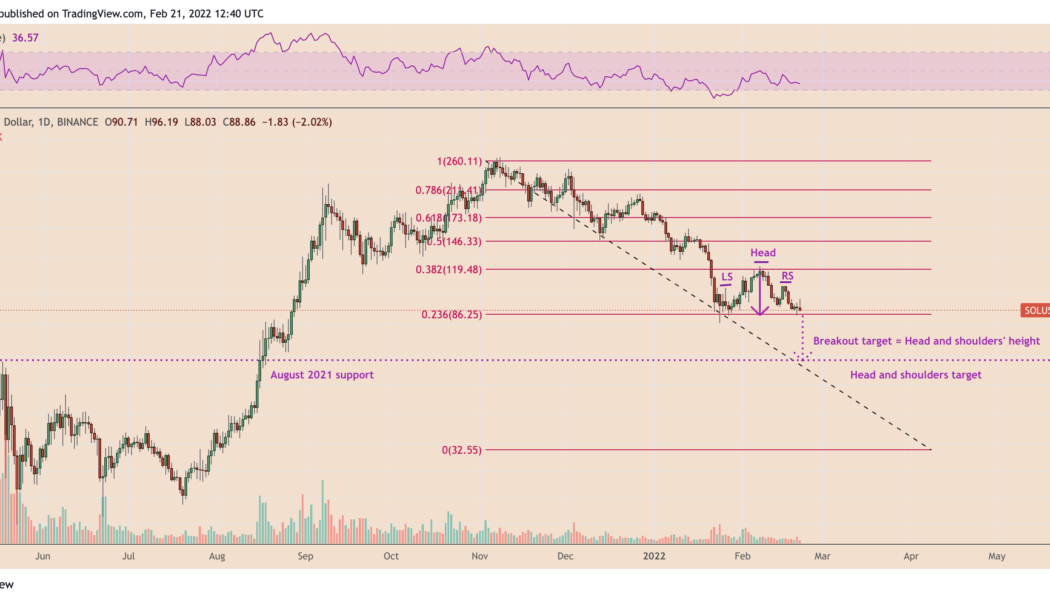
A rebound move witnessed in the Solana (SOL) market this weekend exhausted midway as its price dropped below the $90 level from a high of $96 on Feb. 21. In doing so, SOL price technicals are now risking a classic bearish reversal setup. Solana price risks dropping to $60 Dubbed head-and-shoulders (H&S), the technical pattern emerges when the price forms three peaks in a row atop a common support level (called a neckline). As it typically turns out, the pattern’s middle peak, called a “head,” comes longer than the other two peaks, called theleft and right shoulders, which come to be of similar heights. The H&S pattern tends to send the prices lower—at length equal to the maximum distance between the head and the neckline—once they decisively break below its ...
- 1
- 2
