SOL USD

Solana (SOL) price is poised for a potential 95% crash — Here’s why
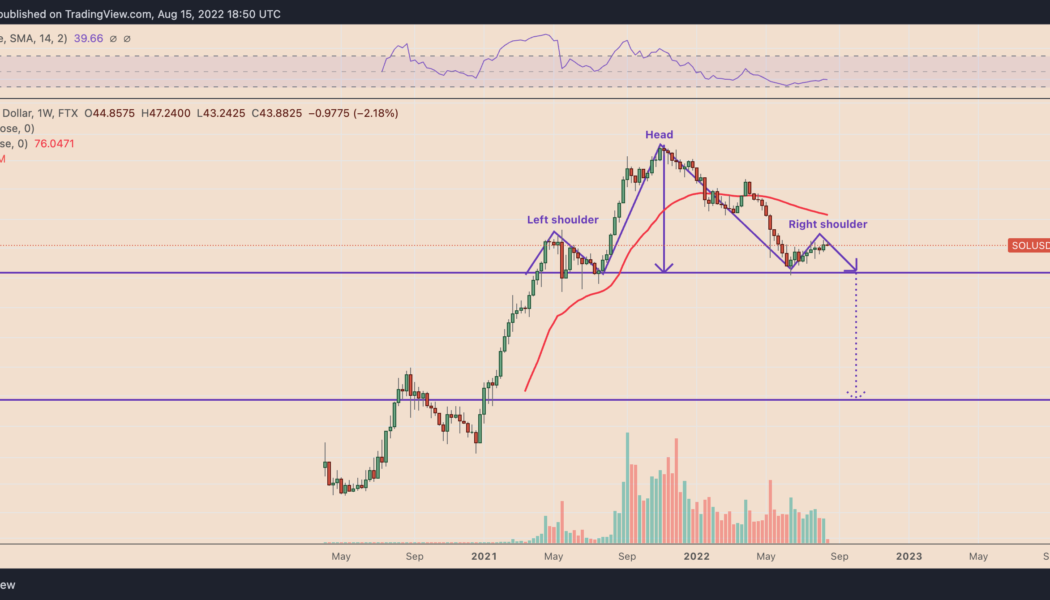
Solana (SOL) price rallied by approximately 75% two months after bottoming out locally near $25.75, but the token’s splendid upside move is at risk of a complete wipeout due to an ominous bearish technical indicator. A major SOL crash setup surfaces Dubbed a “head-and-shoulders (H&S),” the pattern appears when the price forms three consecutive peaks atop a common resistance level (called the neckline). Notably, the middle peak (head) comes to be higher than the other two shoulders, which are of almost equal height. Head and shoulders patterns resolve after the price breaks below their neckline. In doing so, the price falls by as much as the distance between the head’s peak and the neckline when measured from the breakdown point, per a rule of technical analysis....
Solana (SOL) price is poised for a potential 95% crash — Here’s why
Solana (SOL) price rallied by approximately 75% two months after bottoming out locally near $25.75, but the token’s splendid upside move is at risk of a complete wipeout due to an ominous bearish technical indicator. A major SOL crash setup surfaces Dubbed a “head-and-shoulders (H&S),” the pattern appears when the price forms three consecutive peaks atop a common resistance level (called the neckline). Notably, the middle peak (head) comes to be higher than the other two shoulders, which are of almost equal height. Head and shoulders patterns resolve after the price breaks below their neckline. In doing so, the price falls by as much as the distance between the head’s peak and the neckline when measured from the breakdown point, per a rule of technical analysis....

Ominous Solana technicals hint at SOL price crashing 35% by September
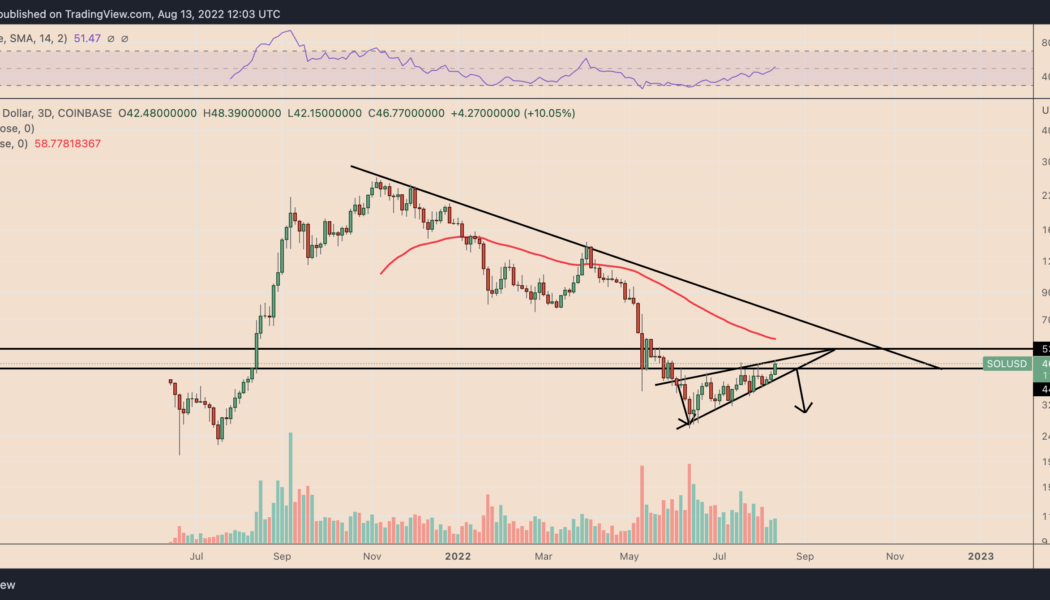
Solana (SOL) risks a significant price correction in the coming weeks owing to a classic bearish reversal setup. A 35% SOL price correction ahead? On the three-day chart, SOL’s price has been painting a rising wedge, confirmed by two ascending, converging trendlines and falling trading volumes in parallel. Rising wedges typically result in breakdown, resolving after the asset’s price break below the lower trendline. If the price follows the breakdown scenario, it could fall by as much as the maximum distance between the wedge’s upper and lower trendline. SOL is far from a breakdown but trades within a falling wedge range, as shown in the chart below. The token eyes an immediate pullback from the wedge’s upper trendline with its interim downside target sitting at the...

Solana price just one breakdown away from a 40% slide in June — here’s why
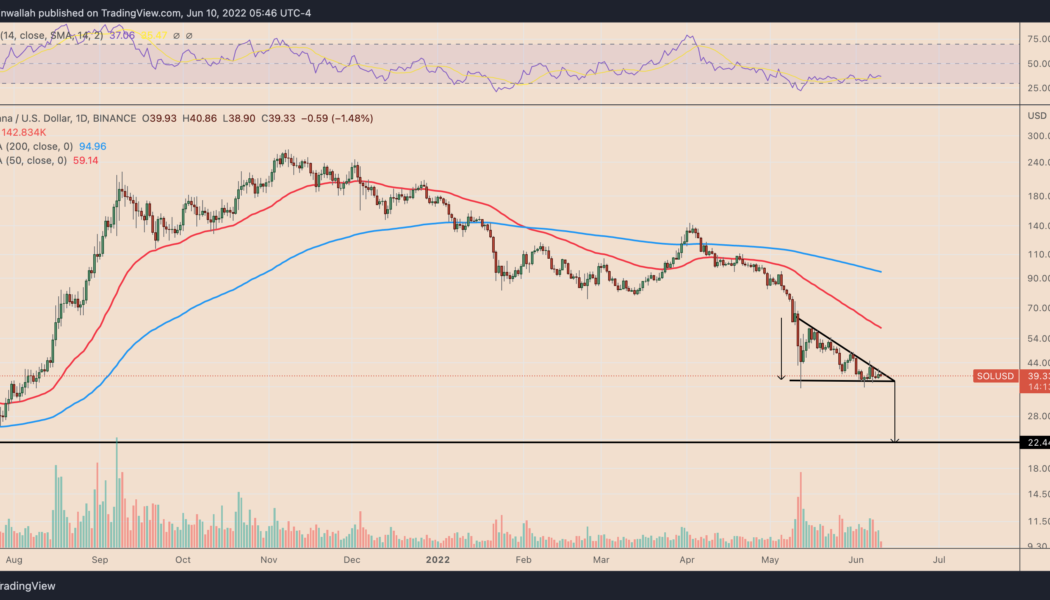
Solana (SOL) is nearing a decisive breakdown moment as it inches towards the apex of its prevailing “descending triangle” pattern. SOL’s 40% price decline setup Notably, SOL’s price has been consolidating inside a range defined by a falling trendline resistance and horizontal trendline support, which appears like a descending triangle—a trend continuation pattern. Therefore, since SOL has been trending lower, down about 85% from its November 2021 peak of $267, its likelihood of breaking below the triangle range is higher. As a rule of technical analysis, a breakdown move followed by the formation of a descending triangle could last until the price has fallen by as much as the triangle’s maximum height. This puts SOL’s bearish price target at $22.50 ...