SOL Price

Solana (SOL) price is poised for a potential 95% crash — Here’s why
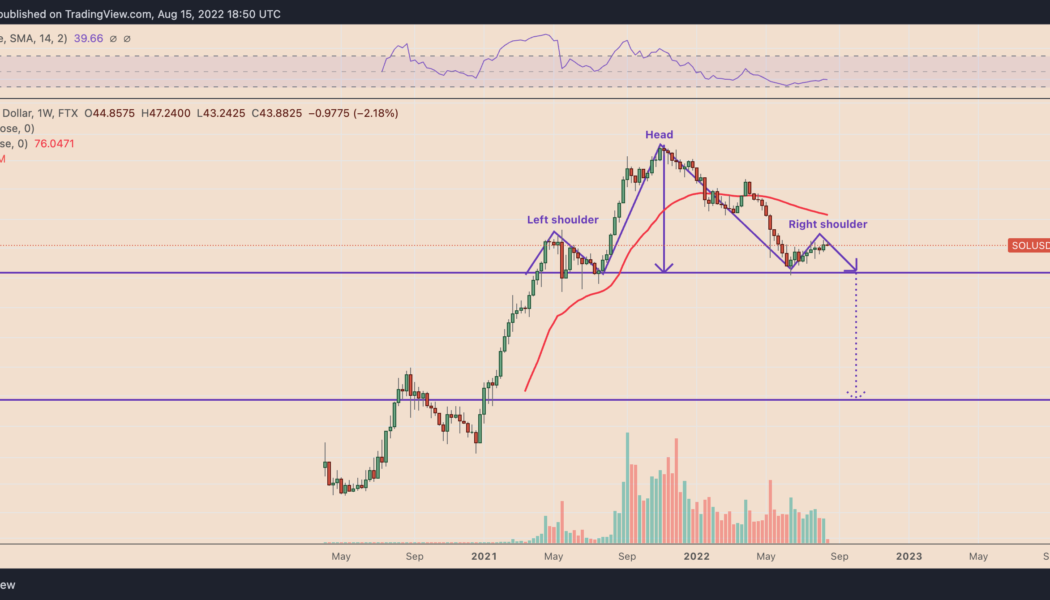
Solana (SOL) price rallied by approximately 75% two months after bottoming out locally near $25.75, but the token’s splendid upside move is at risk of a complete wipeout due to an ominous bearish technical indicator. A major SOL crash setup surfaces Dubbed a “head-and-shoulders (H&S),” the pattern appears when the price forms three consecutive peaks atop a common resistance level (called the neckline). Notably, the middle peak (head) comes to be higher than the other two shoulders, which are of almost equal height. Head and shoulders patterns resolve after the price breaks below their neckline. In doing so, the price falls by as much as the distance between the head’s peak and the neckline when measured from the breakdown point, per a rule of technical analysis....
Solana (SOL) price is poised for a potential 95% crash — Here’s why
Solana (SOL) price rallied by approximately 75% two months after bottoming out locally near $25.75, but the token’s splendid upside move is at risk of a complete wipeout due to an ominous bearish technical indicator. A major SOL crash setup surfaces Dubbed a “head-and-shoulders (H&S),” the pattern appears when the price forms three consecutive peaks atop a common resistance level (called the neckline). Notably, the middle peak (head) comes to be higher than the other two shoulders, which are of almost equal height. Head and shoulders patterns resolve after the price breaks below their neckline. In doing so, the price falls by as much as the distance between the head’s peak and the neckline when measured from the breakdown point, per a rule of technical analysis....

Ominous Solana technicals hint at SOL price crashing 35% by September
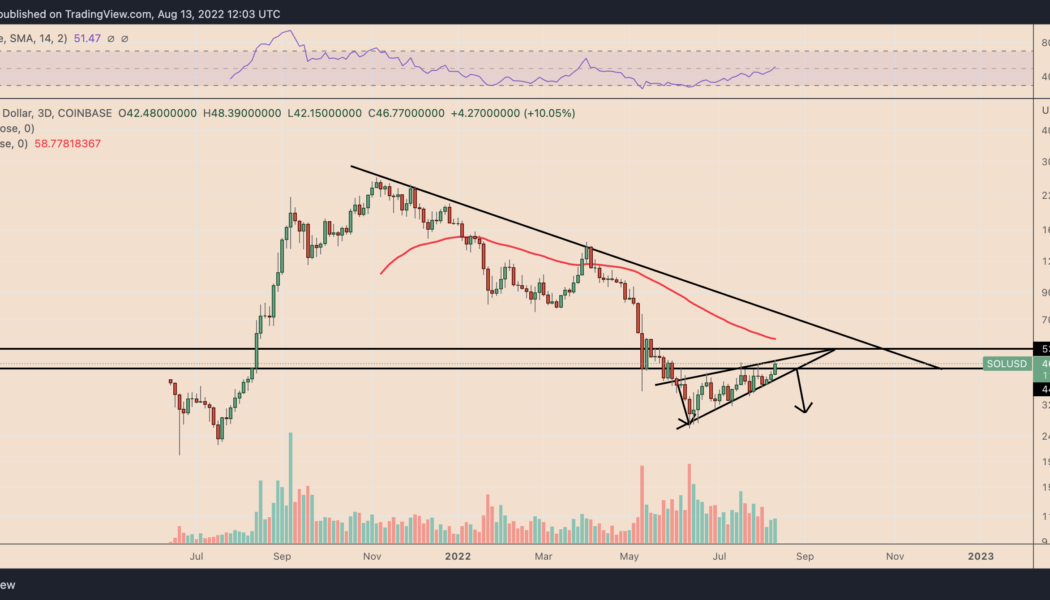
Solana (SOL) risks a significant price correction in the coming weeks owing to a classic bearish reversal setup. A 35% SOL price correction ahead? On the three-day chart, SOL’s price has been painting a rising wedge, confirmed by two ascending, converging trendlines and falling trading volumes in parallel. Rising wedges typically result in breakdown, resolving after the asset’s price break below the lower trendline. If the price follows the breakdown scenario, it could fall by as much as the maximum distance between the wedge’s upper and lower trendline. SOL is far from a breakdown but trades within a falling wedge range, as shown in the chart below. The token eyes an immediate pullback from the wedge’s upper trendline with its interim downside target sitting at the...

Solana price just one breakdown away from a 40% slide in June — here’s why
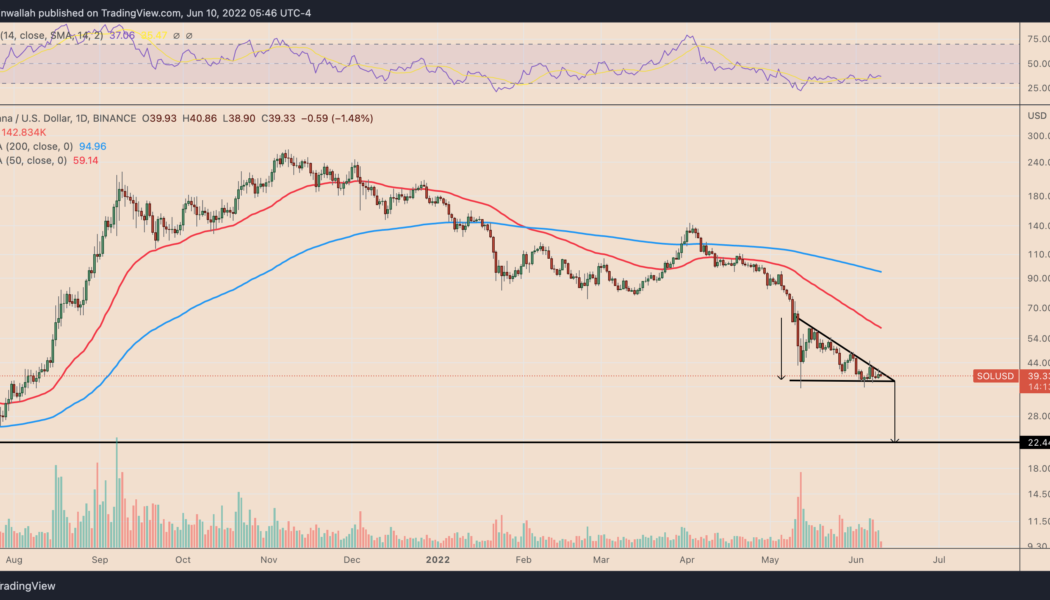
Solana (SOL) is nearing a decisive breakdown moment as it inches towards the apex of its prevailing “descending triangle” pattern. SOL’s 40% price decline setup Notably, SOL’s price has been consolidating inside a range defined by a falling trendline resistance and horizontal trendline support, which appears like a descending triangle—a trend continuation pattern. Therefore, since SOL has been trending lower, down about 85% from its November 2021 peak of $267, its likelihood of breaking below the triangle range is higher. As a rule of technical analysis, a breakdown move followed by the formation of a descending triangle could last until the price has fallen by as much as the triangle’s maximum height. This puts SOL’s bearish price target at $22.50 ...

3 reasons Ethereum price risks 25% downside in June
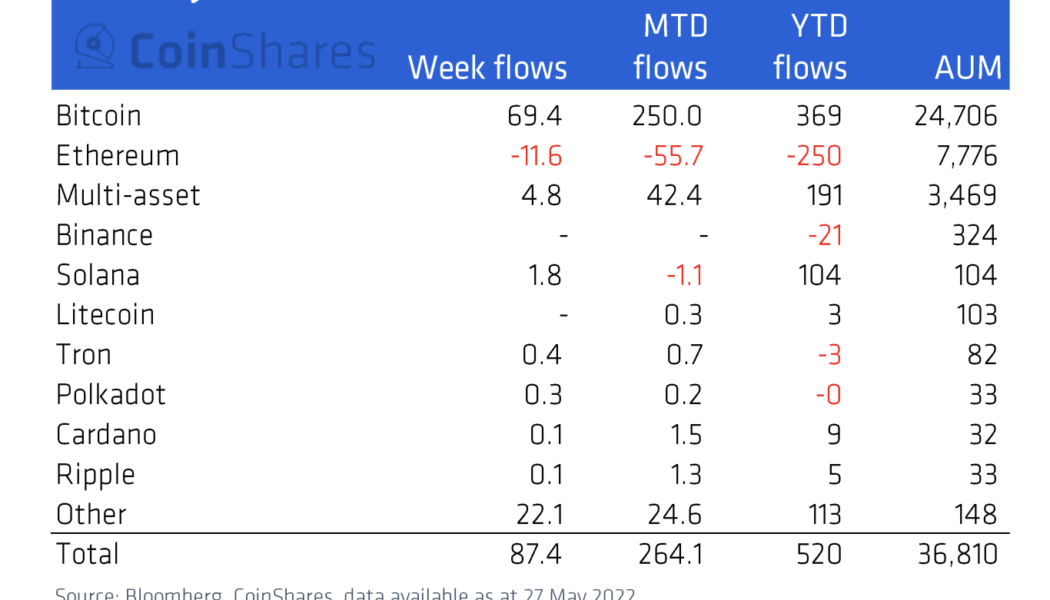
Ethereum’s native token Ether (ETH) has dropped more than half of its value in 2022 in dollar terms, while also losing value against Bitcoin (BTC) and now remains pinned below $2,000 for several reasons. What’s more, ETH price could face even bigger losses in June due to another slew of factors, which will be discussed below. Ethereum funds lose capital en masse Investors have withdrawn $250 million out of Ethereum-based investment funds in 2022, according to CoinShares’ weekly market report published May 31. The massive outflow appears in contrast to other coins. For instance, investors have poured $369 million into Bitcoin-based investment funds in 2022. Meanwhile, Solana and Cardano, layer-one blockchain protocols competing with Ethereum, have attracted $104 million and ...

Spooky Solana breakdown begins with SOL price facing a potential 45% drop — Here’s why
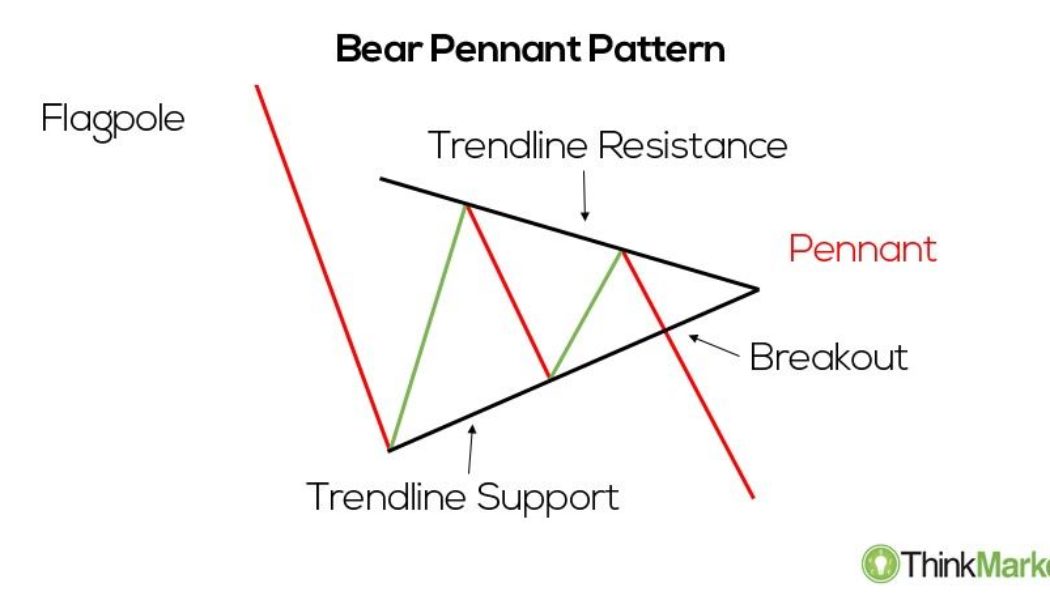
Solana (SOL) dropped on May 26, continuing its decline from the previous day amid a broader retreat across the crypto market. SOL price pennant breakdown underway SOL price fell by over 13% to around $41.60, its lowest level in almost two weeks. Notably, the SOL/USD pair also broke out of what appears to be like a “bear pennant,” a classic technical pattern whose occurrences typically precede additional downside moves in a market. In detail, bear pennants appear when the price trades inside a range defined by a falling trendline resistance and rising trendline support. Bear pennant pattern. Source: ThinkMarkets These patterns resolve after the price breaks below the lower trendline, accompanied by higher volumes. As a rule of technical analysis, traders decide the pennant’...

Solana jumps past key selloff junction: SOL price eyes $150 in April
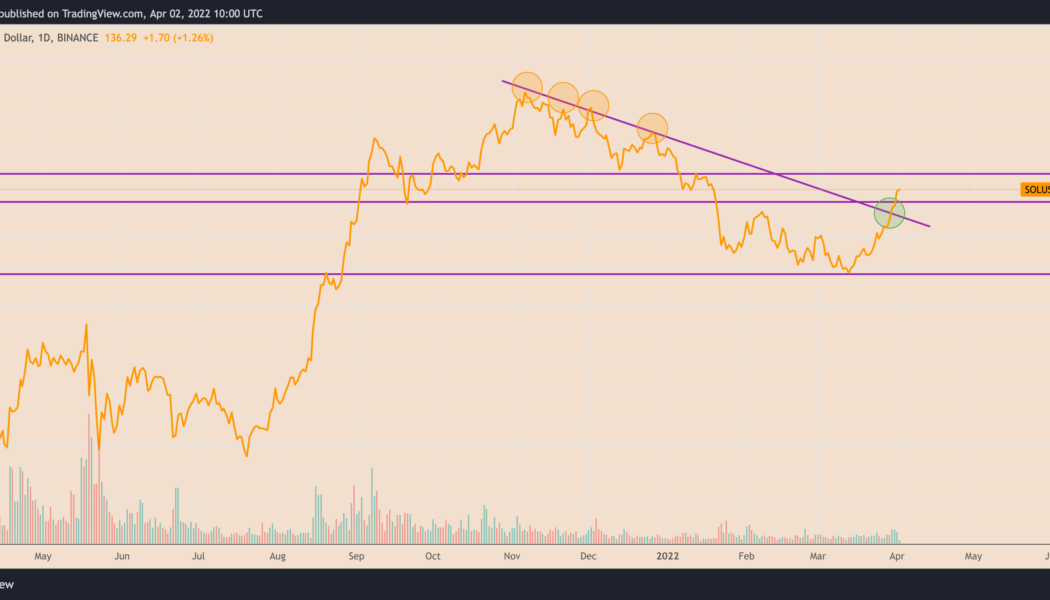
Solana (SOL) jumped past a critical resistance level that had limited its recovery attempts during the November 2021-March 2022 price correction multiple times, thus raising hopes of more upside in April. Solana flips key resistance to support To recap, SOL’s price underwent extreme pullbacks upon testing its multi-month downward sloping trendline in recent history. For instance, the SOL/USD pair dropped by 60% two months after retracing from the said resistance level in December 2021. Similarly, it had fallen by over 40% in a similar retracement move led by a selloff near the trendline in November 2021. SOL/USD daily price chart. Source: TradingView But Solana flipped the resistance trendline as support (S/R flip) after breaking above it on March 30, accompanied by a rise in trading...

Solana’s weekend bounce risks turning into a bull trap — Can SOL price fall to $60 next?
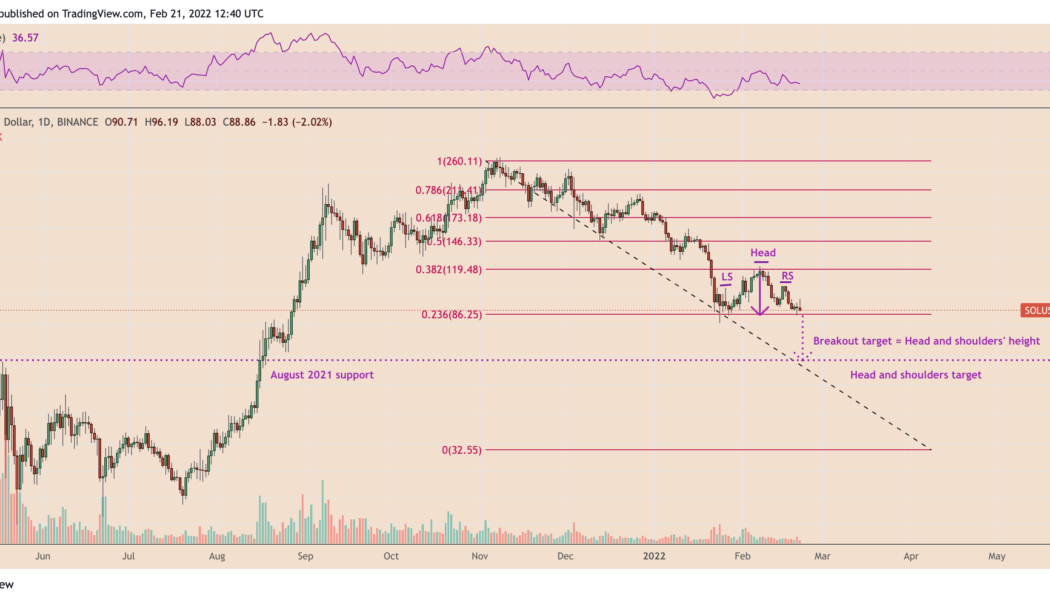
A rebound move witnessed in the Solana (SOL) market this weekend exhausted midway as its price dropped below the $90 level from a high of $96 on Feb. 21. In doing so, SOL price technicals are now risking a classic bearish reversal setup. Solana price risks dropping to $60 Dubbed head-and-shoulders (H&S), the technical pattern emerges when the price forms three peaks in a row atop a common support level (called a neckline). As it typically turns out, the pattern’s middle peak, called a “head,” comes longer than the other two peaks, called theleft and right shoulders, which come to be of similar heights. The H&S pattern tends to send the prices lower—at length equal to the maximum distance between the head and the neckline—once they decisively break below its ...

Bearish chart pattern hints at $70 Solana (SOL) price before a possible oversold bounce
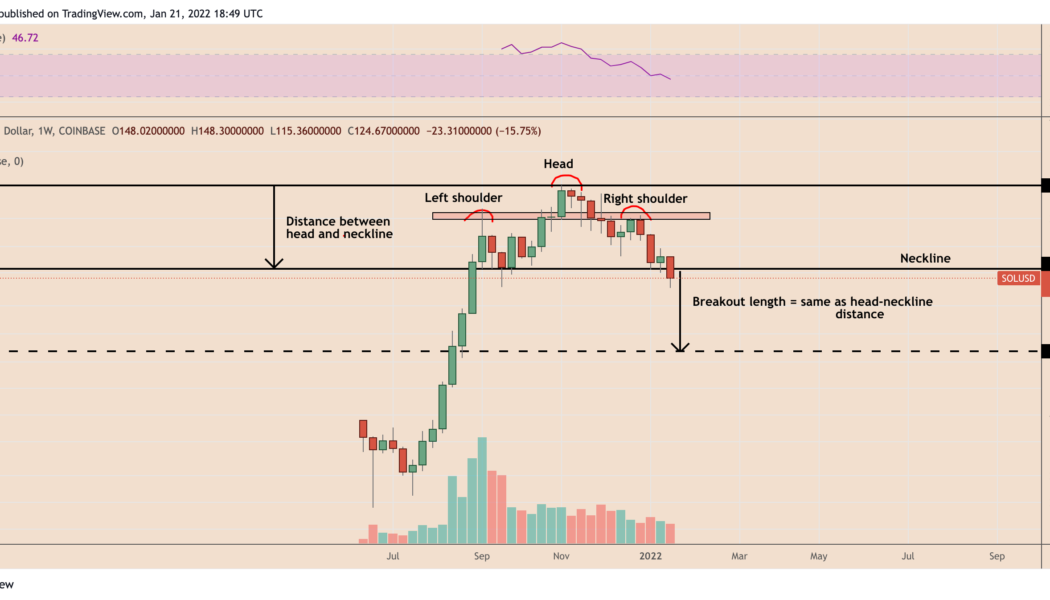
Solana (SOL) price may fall to $70 a token in the coming weeks as a head and shoulders setup emerged on the daily timeframe and possibly points toward a 45%+ decline. The chart below shows that SOL price rallied to nearly $217 in September 2021, dropped to a support level near $134 and then moved to establish a new record high of $260 in November 2021. Earlier this week, the price fell back to test the same $134-support level before breaking to a 2022 low at $87.73. SOL/USD weekly price chart featuring head and shoulders setup. Source: TradingView This phase of price action appears to have formed a head and shoulders setup, a bearish reversal pattern containing three consecutive peaks, with the middle one around $257 (called the “head”) coming out to be higher than the oth...