REN
Alameda tried to redeem 3,000 wBTC days before bankruptcy: BitGo CEO
Mike Belshe, the CEO of digital asset custodian BitGo has confirmed that Alameda Research attempted to redeem 3,000 Wrapped Bitcoin (wBTC) in the days before FTX’s bankruptcy filing on Nov. 11. During a Dec. 14 Twitter Spaces hosted by decentralized finance (DeFi) researcher Chris Blec, Belshe confirmed the firm knocked back the redemption request because the unknown Alameda representative involved didn’t pass Bitgo’s security verification process and seemed unfamiliar with how the wrapped Bitcoin burning process worked. Full convo here. This part starts at 1:09:30. https://t.co/0KQg6bzd8k — Chris Blec (@ChrisBlec) December 14, 2022 “[The security details] didn’t match the process. So we held it up and we said no, no, no, no. This is not what the burn looks like. And we need to...
REN price gains 65% after Catalog launch brings a cross-chain DEX to its blockchain
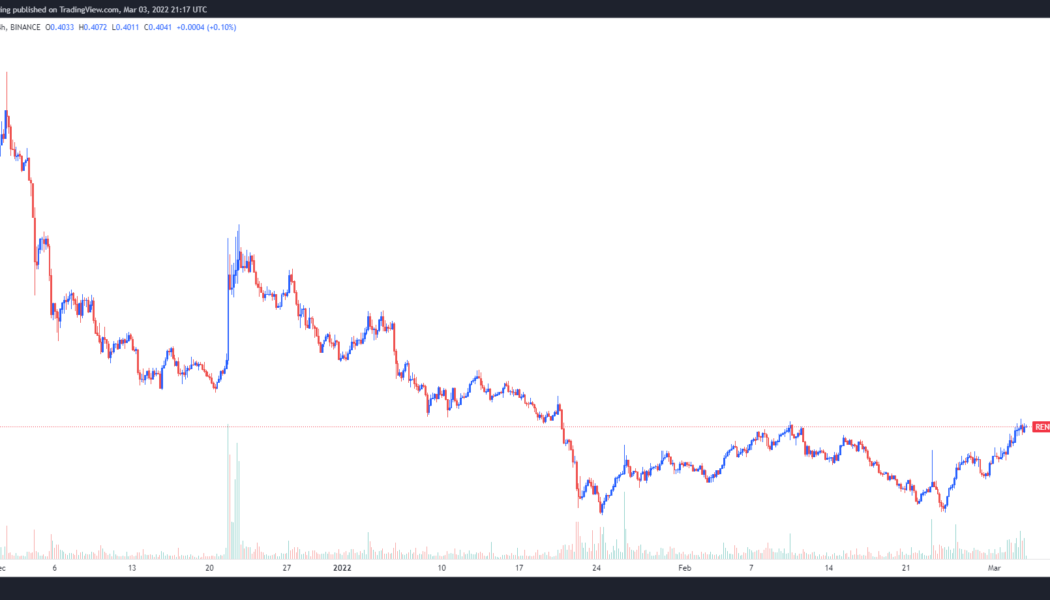
Decentralized finance projects like Ren pumped in 2021, only to finish the year right back where they started as high fees on Ethereum (ETH) led to decreased activity for many protocols and DeFi took a backseat to more popular sectors like nonfungible tokens (NFTs). Now, it appears as though that downtrend is in the process of reversing course after recent global events highlighted the benefits of DeFi and holding assets outside the traditional financial system. This week REN price climbed 69% from a low of $0.247 on Feb. 24 to a daily high of $0.418 on March 3. REN/USDT 4-hour chart. Source: TradingView Three reasons for the potential price reversal in REN are the launch of its first layer-one application Catalog, the launch of VarenX on Polygon and several new partnerships and inte...
REN price at risk of 50% drop after a bearish trading pattern shows up
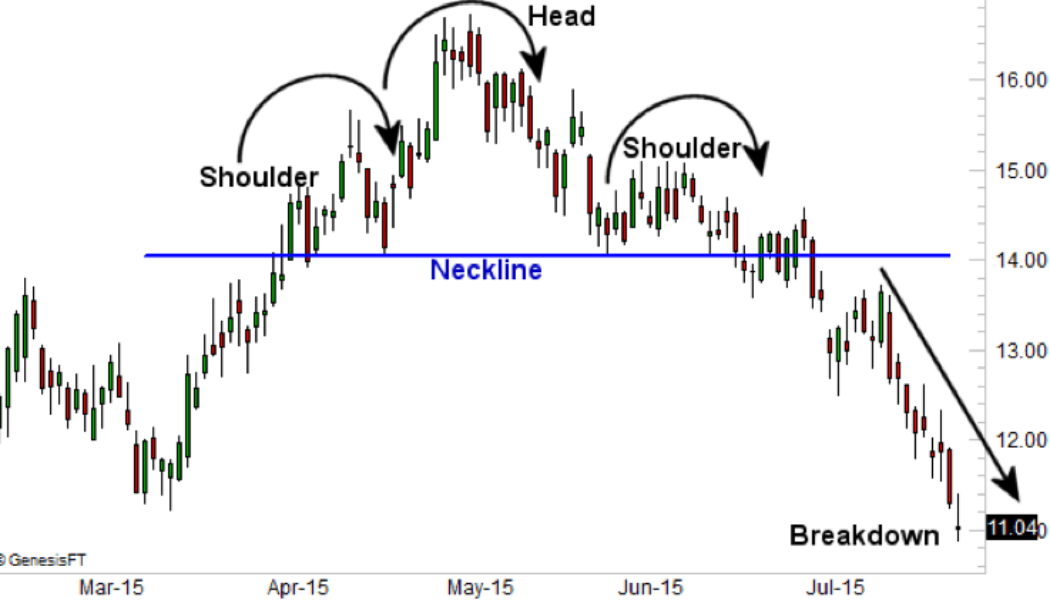
The prospects of Ren (REN) continuing its ongoing rebound to fresh highs appear slim as a classic bearish reversal pattern begins to emerge. Dubbed head and shoulders, the setup appears when the price forms three peaks, with the middle peak (called the head) longer than the other two peaks described as the left and right shoulders. The bottoms of these peaks are supported by a neckline. An illustration of the head and shoulders pattern. Source: Corporate Finance Institute The pattern comes into play primarily when the price breaks below the neckline in a correction that follows the formation of the right shoulder. That prompts traders to open short entries below the neckline, with their ideal target at a length equal to the distance between the head’s high point and the neckline. Wha...


