Polygon Analysis
Polygon price risks 50% drop as MATIC paints inverted cup and handle pattern
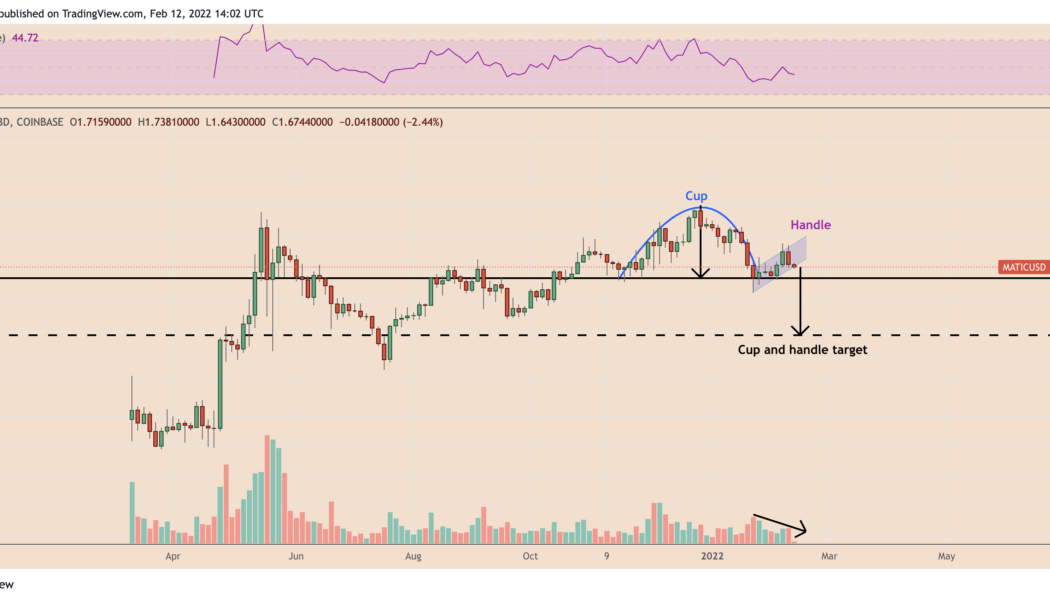
Polygon (MATIC) has dropped by more than 40% from its record high of $2.92, established on Dec. 27, 2021. But if a classic technical indicator is to be believed, the token has more room to drop in the sessions ahead. MATIC price chart painting classic bearish pattern MATIC’s recent rollover from bullish to bearish, followed by a rebound to the upside, has led to the formation of what appears like an inverted cup and handle pattern — a large crescent shape followed by a less extreme upside retracement, as shown in the chart below. MATIC/USD three-day price chart featuring inverted cup and handle pattern. Source: TradingView In a “perfect” scenario, inverted cup and handle setups set the stage for a downturn ahead. As they do, the price tends to fall towards levels tha...

