NASDAQ
Can Cardano’s July hard fork prevent ADA price from plunging 60%?
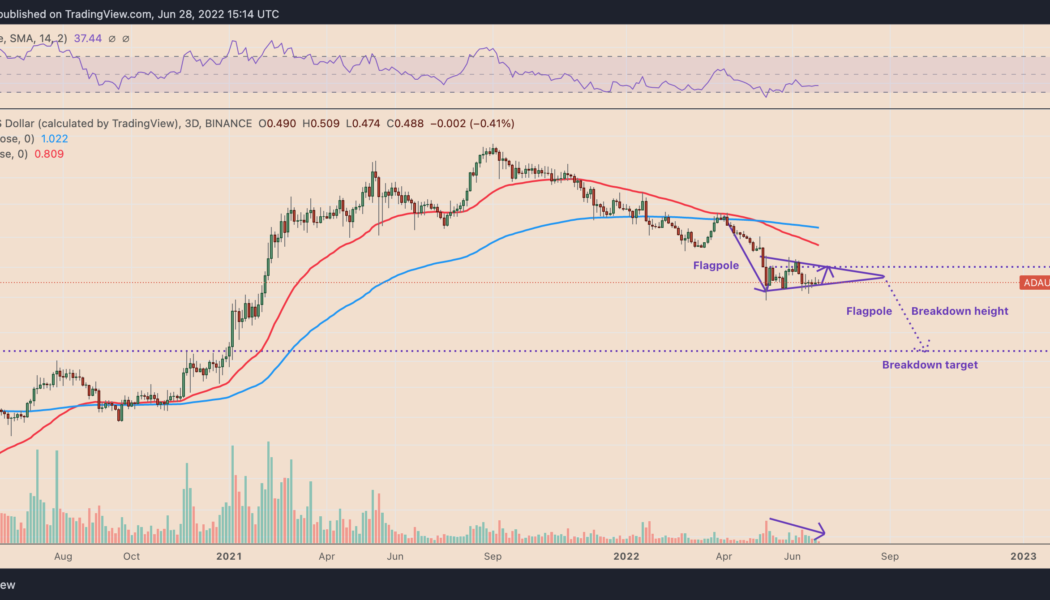
Cardano (ADA) has started painting a bearish continuation pattern on its longer-timeframe charts, raising its likelihood of undergoing a major price crash by August. ADA price in danger of a 60% plunge Dubbed the “bear pennant,” the pattern forms when the price consolidates inside a range defined by a falling trendline resistance and rising trendline support after a strong move downside. Additionally, the consolidation moves accompany a decrease in trading volumes. Bear pennants typically resolve after the price breaks below their trendline support and, as a rule, could fall by as much as the height of the previous big downtrend, called a “flagpole,” as illustrated in the chart below. ADA/USD three-day price chart featuring “bear pennant'”setup. So...
XRP price rally stalls near key level that last time triggered a 65% crash
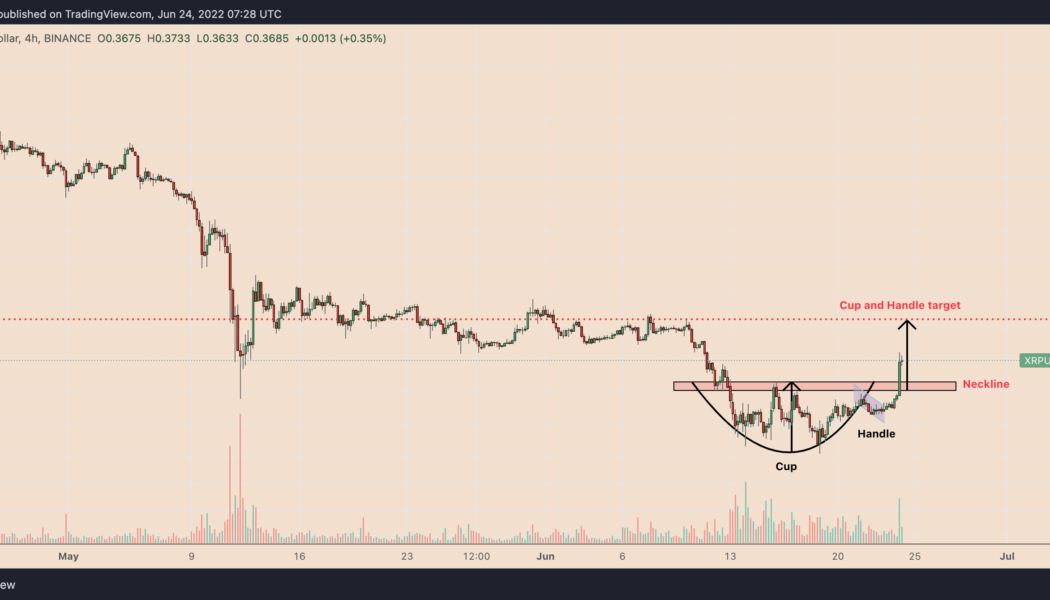
Ripple’s (XRP) ongoing upside retracement risks exhaustion as its price tests a resistance level with a history of triggering a 65% price crash. XRP price rebounds 30% XRP’s price gained nearly 30%, rising to $0.36 on June 24, four days after rebounding from $0.28, its lowest level since January 2021. The token’s retracement rally could extend to $0.41 next, according to its cup-and-handle pattern shown in the chart below. XRP/USD four-hour price chart featuring “cup and handle” pattern. Source: TradingView Interestingly, the indicator’s profit target is the same as XRP’s 50-day exponential moving average (50-day EMA; the red wave). XRP/USD daily price chart featuring 50-day EMA upside target. Source: TradingView Major resistance hurdle The cup-and-handle bullis...
Weak stocks and declining DeFi use continue to weigh on Ethereum price
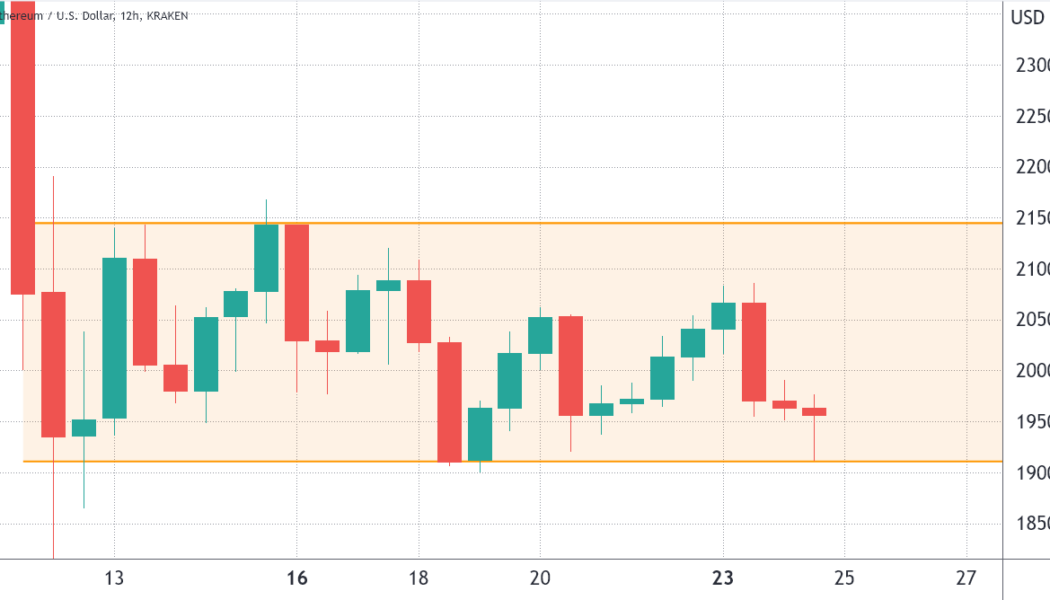
Ether’s (ETH) 12-hour closing price has been respecting a tight $1,910 to $2,150 range for twelve days, but oddly enough, these 13% oscillations have been enough to liquidate an aggregate of $495 million in futures contracts since May 13, according to data from Coinglass. Ether/USD 12-hour price at Kraken. Source: TradingView The worsening market conditions were also reflected in digital asset investment products. According to the latest edition of CoinShare’s weekly Digital Asset Fund Flows report, crypto funds and investment products saw a $141 million outflow during the week ending on May 20. In this instance, Bitcoin (BTC) was the investors’ focus after experiencing a $154 weekly net redemption. Russian regulation and crumbling U.S. tech stocks escalate the situation Regula...
20% drop in the S&P 500 puts stocks in a bear market, Bitcoin and altcoins follow
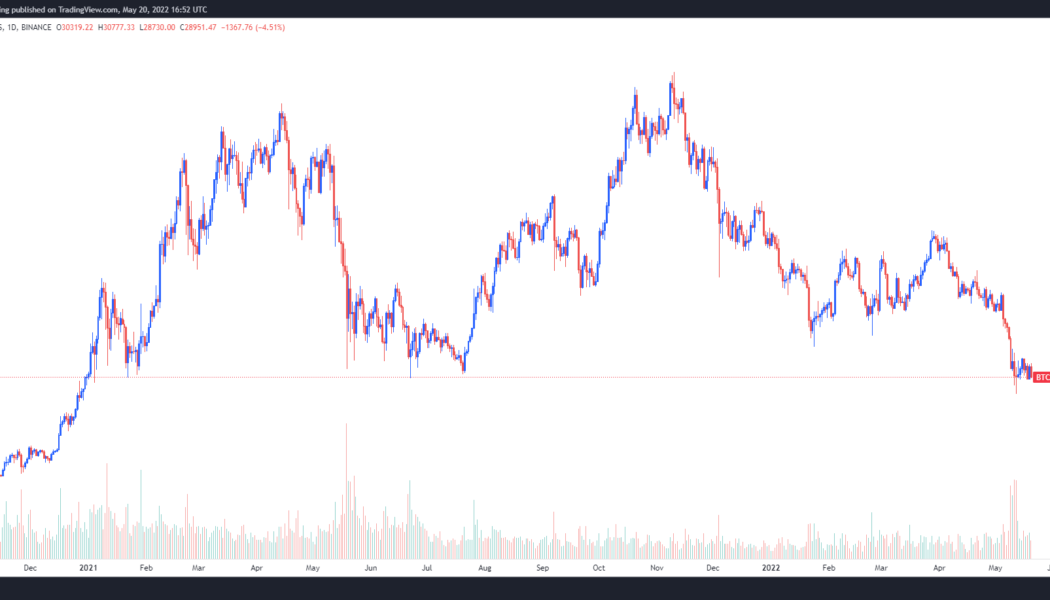
Whoever coined the phrase “sell in May and go away” had brilliant insight and the performance of crypto and stock markets over the past three weeks has shown that the expression still rings true. May 20 has seen a pan selloff across all asset classes, leaving traders with few options to escape the carnage as inflation concerns and rising interest rates continue to dominate the headlines. Data from Cointelegraph Markets Pro and TradingView shows that the price of Bitcoin (BTC) taking on water below $29,000 and traders worry that losing this level will ensure a visit to the low $20,000s over the coming week. BTC/USDT 1-day chart. Source: TradingView As reported by Cointelegraph, some analysts warn that BTC could possibility decline to $22,700 based on its historical price performance fo...
ApeCoin rebounds after APE price crashes 80% in two weeks: Dead cat bounce or bottom?
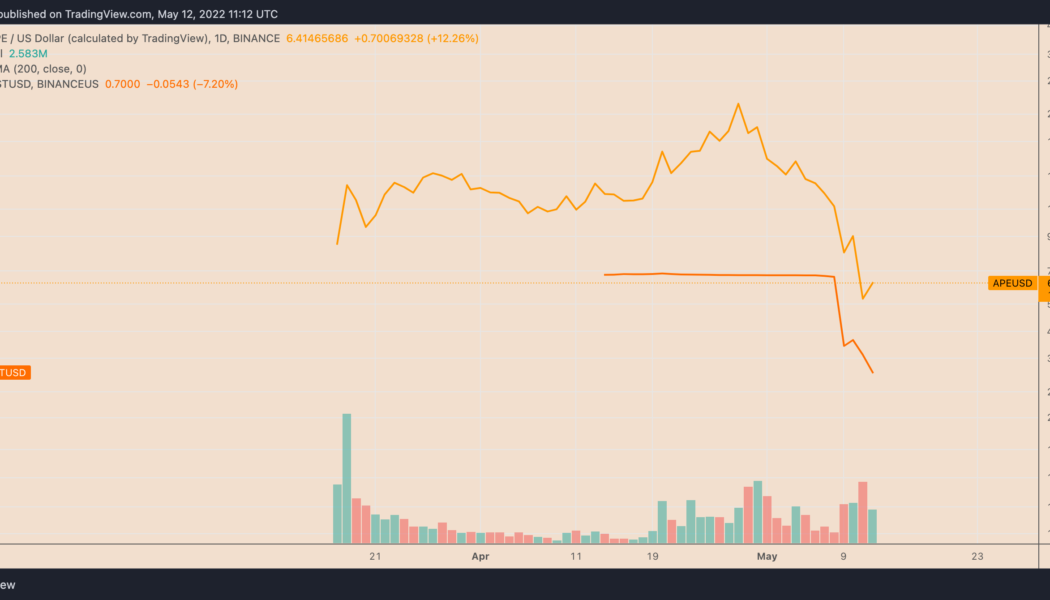
ApeCoin (APE) has undergone a sharp recovery after falling to its lowest level in two months. But its strong correlation with Bitcoin (BTC) and U.S. equities amid macro risks suggests more losses could be in store. APE rebounds after 80% losses in two weeks APE rebounded by nearly 45% to $7.30 on May 12. The upside retracement move came after APE dropped circa 81% to $5 on May 11, from its record high near $27.50, established on April 28. The seesaw price action mirrored similar volatile moves elsewhere in the crypto market, led by the chaos around TerraUSD (UST) — an “algorithmic stablecoin” whose value plunged to $0.23 earlier this week, and the Federal Reserve’s hawkish response to rising inflation. APE/USD versus USTUSD. Source: TradingView Meanwhile, the correla...
Ethereum price ‘bear flag’ could sink ETH to $2K after 20% decline in three weeks
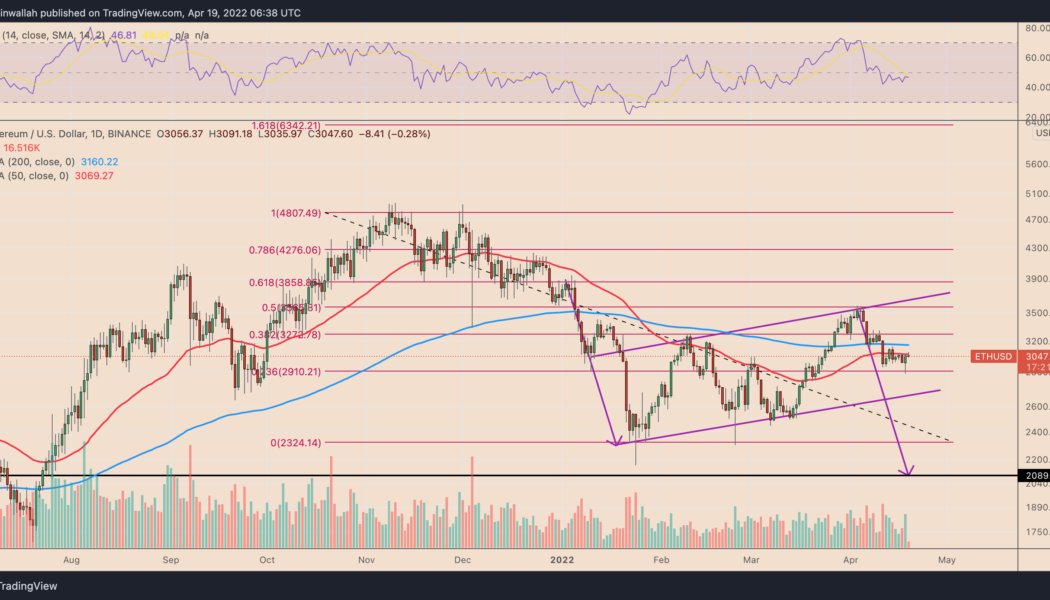
Ethereum’s native token Ether (ETH) has dropped by nearly 20% in the last three weeks, hitting monthly lows near $2,900 on April 19. But despite rebounding above $3,000 since, technicals suggest more downside is possible in the near term, according to a classic bearish pattern. Ethereum price ‘bear flag’ setup activated Dubbed “bear flag,” the bearish continuation signal appears as the price consolidates higher inside an ascending parallel channel after a strong downward move (called the flagpole). It resolves after the price breaks out of the channel to drop further. ETH’s price turned lower after testing its bear flag’s upper trendline on April 4 and now eyes an extended decline towards its lower trendline near $2,700. If the pattern pans out as ...
Bitcoin beats owning COIN stock by 20% since Coinbase IPO
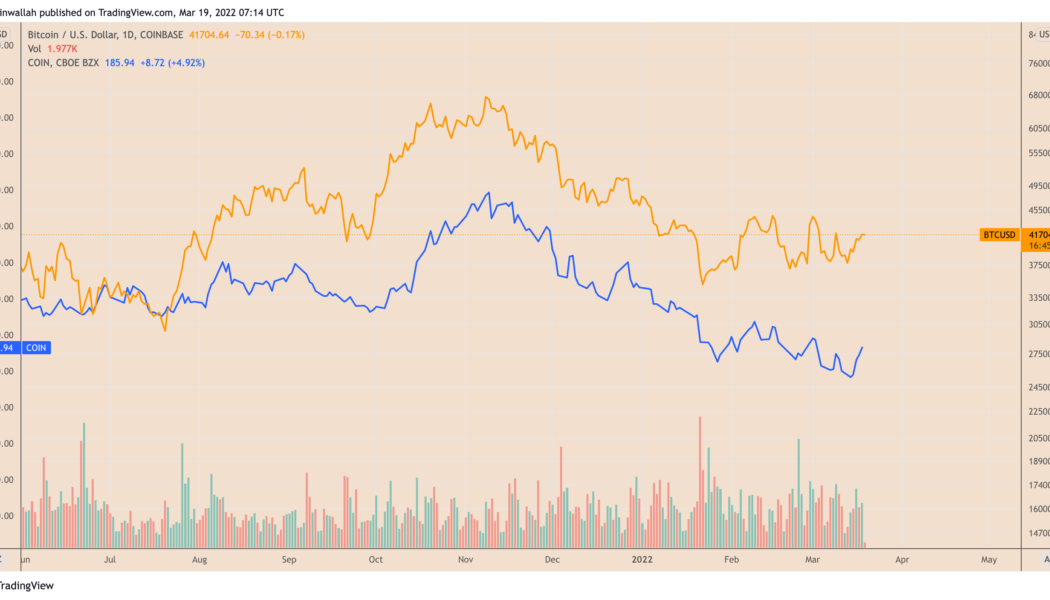
Buying a Coinbase stock (COIN) to gain indirect exposure in the Bitcoin (BTC) market has been a bad strategy so far compared to simply holding BTC. Notably, COIN is down by nearly 50% to almost $186, if measured from the opening rate on its IPO on April 14, 2021. In comparison, Bitcoin outperformed the Coinbase stock by logging fewer losses in the same period — a little over 30% as it dropped from nearly $65,000 to around $41,700 BTC/USD (orange) vs. COIN price (blue). Source: TradingView What’s bothering Coinbase? The correlation between Coinbase and Bitcoin has been largely positive to date, however, suggesting that many investors consider them as assets with similar value propositions. That is primarily due to the buzz around how COIN could become a simpler onboarding experi...
Crypto miner Hut 8 posts record revenue as BTC holdings surge 100%
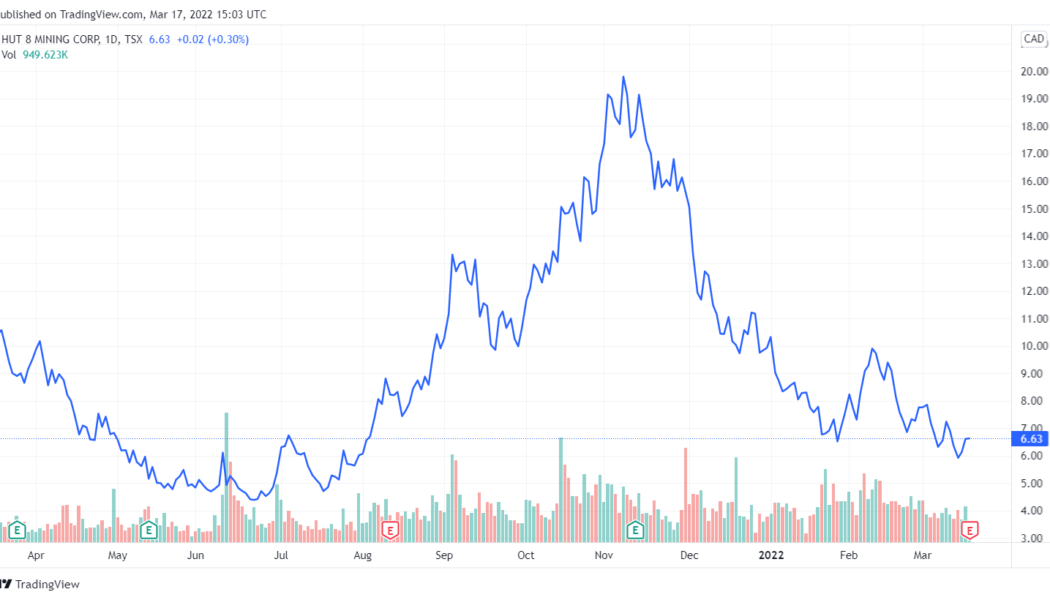
Canadian cryptocurrency miner Hut 8 posted mixed financial results on Thursday, as revenue and mining profitability soared while overall net income declined — underscoring a volatile end to the year for Bitcoin (BTC) and the broader digital asset market. The Toronto-based company, which trades publicly on the Nasdaq and TSX, saw its revenues surge to $45.69 million ($57.901 million CAD) in the fourth quarter of 2021, up from $10.25 million ($12.986 million CAD) the year before. Full-year revenues were $137.1 million, up 326% compared with 2020. Despite generating a large profit from mining activities, the company posted an overall loss of $0.53 ($0.67 CAD) per share in the fourth quarter. Losses amounted to $0.43 ($0.54 CAD) per share in all of 2021. Shares of Hut 8, which trade unde...
3 reasons why Bitcoin can rally back to $60K despite erasing last week’s gains
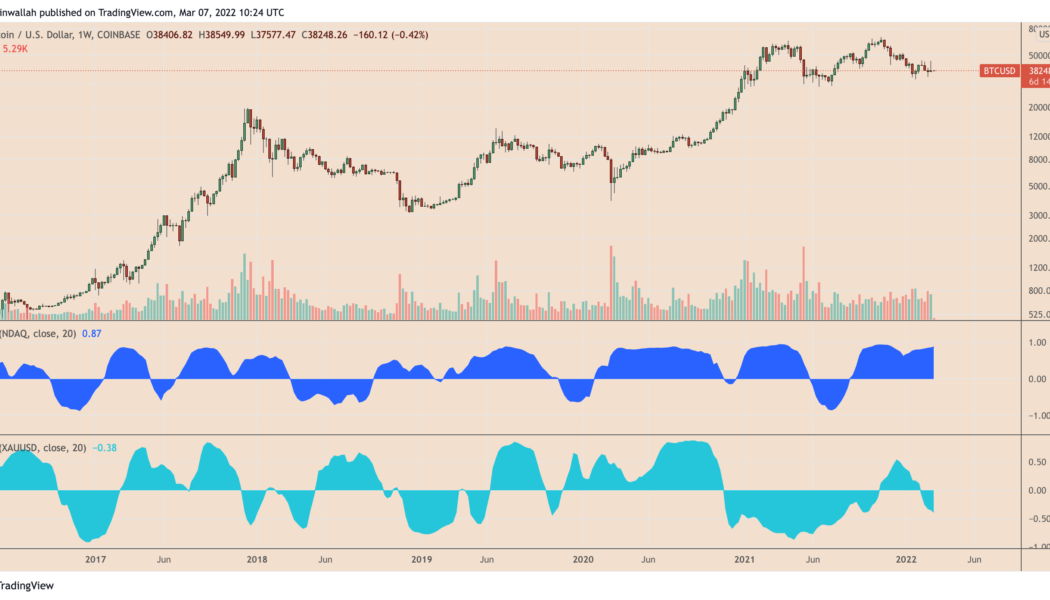
Bitcoin (BTC) plunged to below $38,000 on Monday, giving up all the gains it had made last week, which saw BTC/USD rally over $45,000. BTC back below $40K as oil soars The losses appeared primarily in part due to selloffs across the risk-on markets, led by the 18% rise in international oil benchmark Brent crude to almost $139 per barrel early Monday, its highest level since 2008. Nonetheless, Bitcoin’s inability to offer a hedge against the ongoing market volatility also raised doubts over its “safe haven” status, with its correlation coefficient with Nasdaq Composite reaching 0.87 on Monday. BTC/USD weekly price chart featuring its correlation with Nasdaq and Gold. Source: TradingView Conversely, Bitcoin’s correlation with its top rival gold came to be minus 0...
Can Bitcoin break out vs. tech stocks again? Nasdaq decoupling paints $100K target
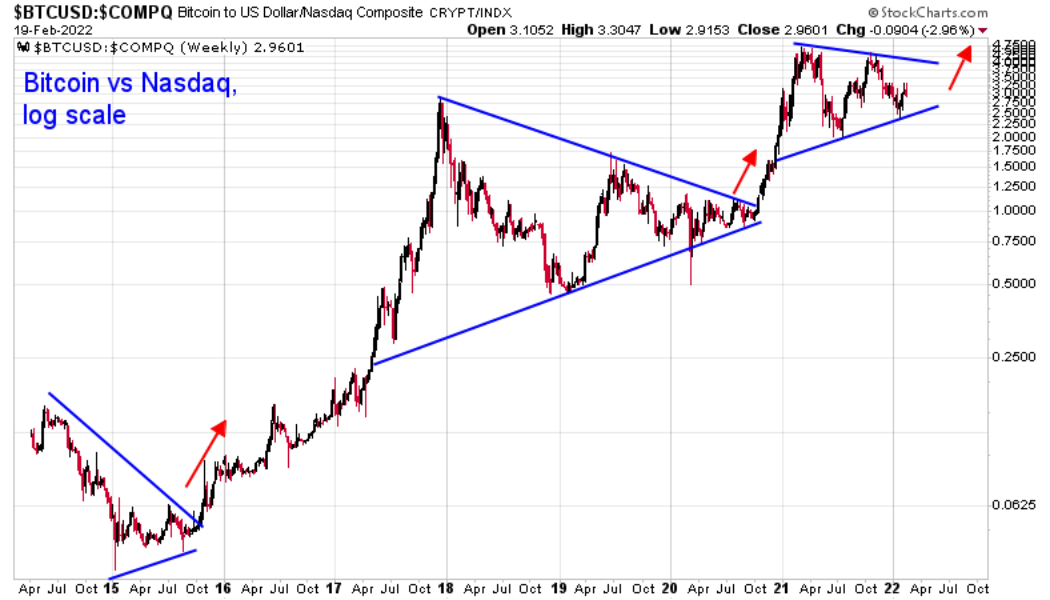
A potential decoupling scenario between Bitcoin (BTC) and the Nasdaq Composite can push BTC price to reach $100,000 within 24 months, according to Tuur Demeester, founder of Adamant Capital. Bitcoin outperforms tech stocks Demeester depicted Bitcoin’s growing market valuation against the tech-heavy U.S. stock market index, highlighting its ability to break out every time after a period of strong consolidation. “It may do so again within the coming 24 months,” he wrote, citing the attached chart below. BTC/USD vs. Nasdaq Composite weekly price chart. Source: Tuur Demeester, StockCharts.com BTC’s price has grown from a mere $0.06 to as high as $69,000 more than a decade after its introduction to the market, as per data tracked by the BraveNewCoin Liquid Index fo...
