Jackson Hole
Why September is shaping up to be a potentially ugly month for Bitcoin price
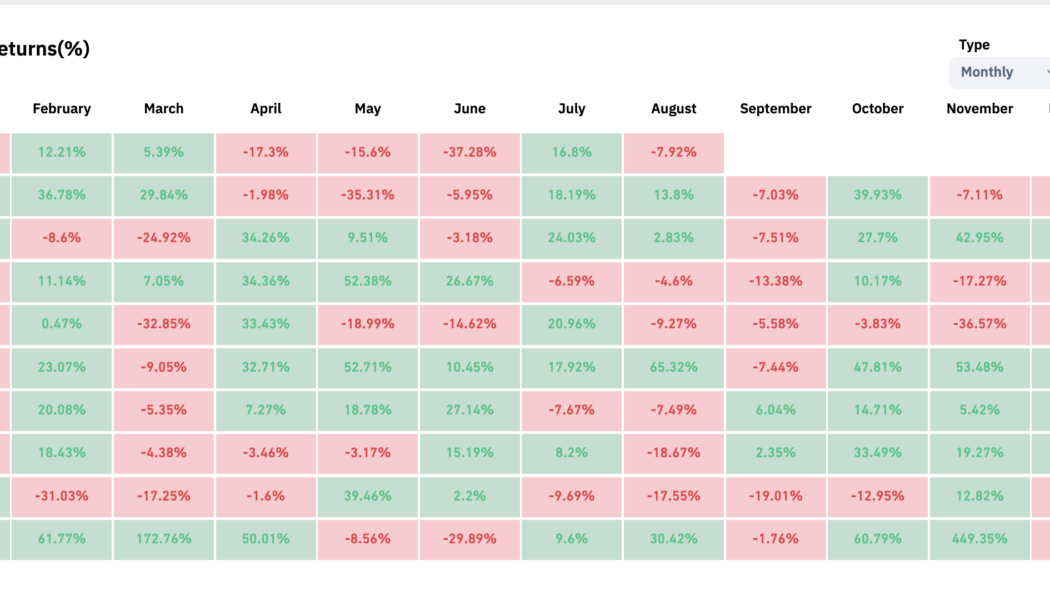
Bitcoin (BTC) bulls should not get excited about the recovery from the June lows of $17,500 just yet as BTC heads into its riskiest month in the coming days. The psychology behind the “September effect” Historic data shows September being Bitcoin’s worst month between 2013 and 2021, except in 2015 and 2016. At the same time, the average Bitcoin price decline in the month is a modest -6%. Bitcoin monthly returns. Source: CoinGlass Interestingly, Bitcoin’s poor track record across the previous September months coincides with similar downturns in the stock market. For instance, the average decline of the U.S. benchmark S&P 500 in September is 0.7% in the last 25 years. S&P 500 performance in August and September since 1998. Source: Bloomberg Traditional chart a...
Bitcoin price taps $21.3K ahead of Fed Chair Powell Jackson Hole speech
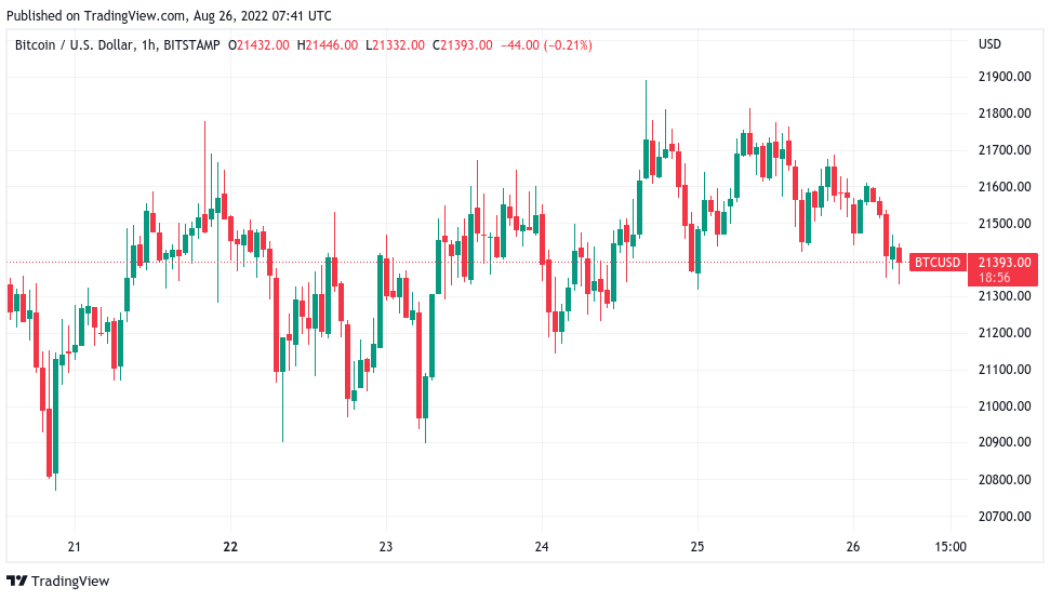
Bitcoin (BTC) fell to daily lows on Aug. 26 as market nerves heightened into new macro triggers. BTC/USD 1-hour candle chart (Bitstamp). Source: TradingView Pre-Fed blues hit BTC markets Data from Cointelegraph Markets Pro and TradingView showed BTC/USD dipping to $21,332 on Bitstamp ahead of fresh commentary from Jerome Powell, Chair of the United States Federal Reserve. Part of the Fed’s Jackson Hole annual symposium, Powell was set to deliver a speech on the day that spectators hoped would provide new cues on economic policy going forward. With U.S. Consumer Price Index (CPI) inflation slowing since June, interest remained high over the extent of key interest rate hikes in September. Summarizing the current economic situation in the U.S., macro analyst David Hunter argued that the Fed w...


