Flippening
The floppening? Ethereum price weakens post-Merge, risking 55% drop against Bitcoin
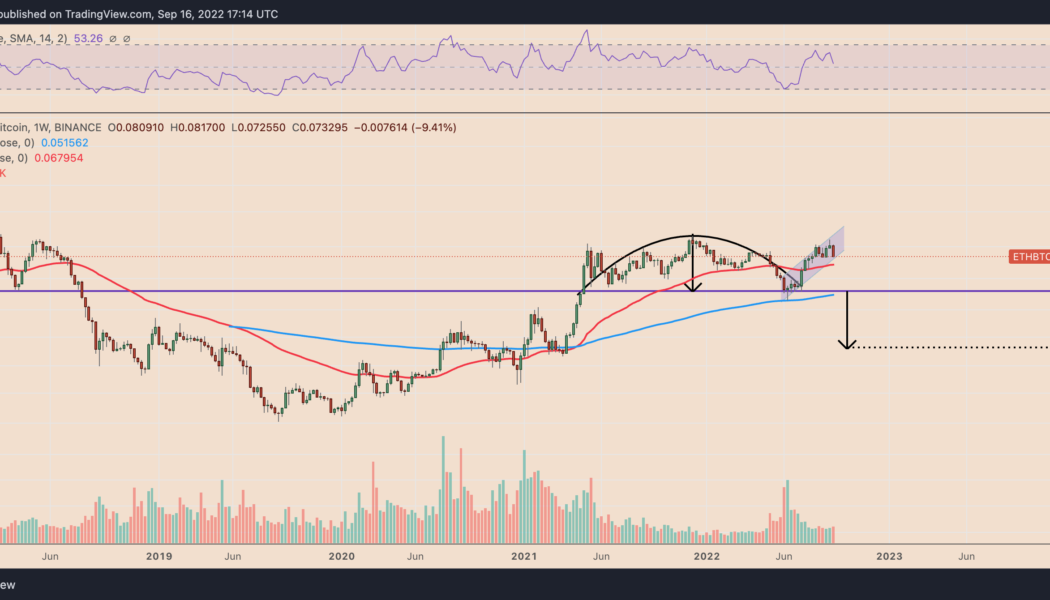
Ethereum’s native token Ether (ETH) has been forming an inverse-cup-and-handle pattern since May 2021 on the weekly chart, which hints at a potential decline against Bitcoin (BTC). ETH/BTC weekly price chart featuring inverse cup-and-handle breakdown setup. Source: TradingView An inverse cup-and-handle is a bearish reversal pattern, accompanied by lower trading volume. It typically resolves after the price breaks below its support level, followed by a fall toward the level at a length equal to the maximum height between the cup’s peak and the support line. Applying the theoretical definition on ETH/BTC’s weekly chart presents 0.03 BTC as its next downside target, down around 55% from Sept. 16’s price. Can ETH/BTC pull a Dow Jones? Alternatively, the ...

