Federal Reserve
Bitcoin’s inverse correlation with US dollar hits 17-month highs — what’s next for BTC?
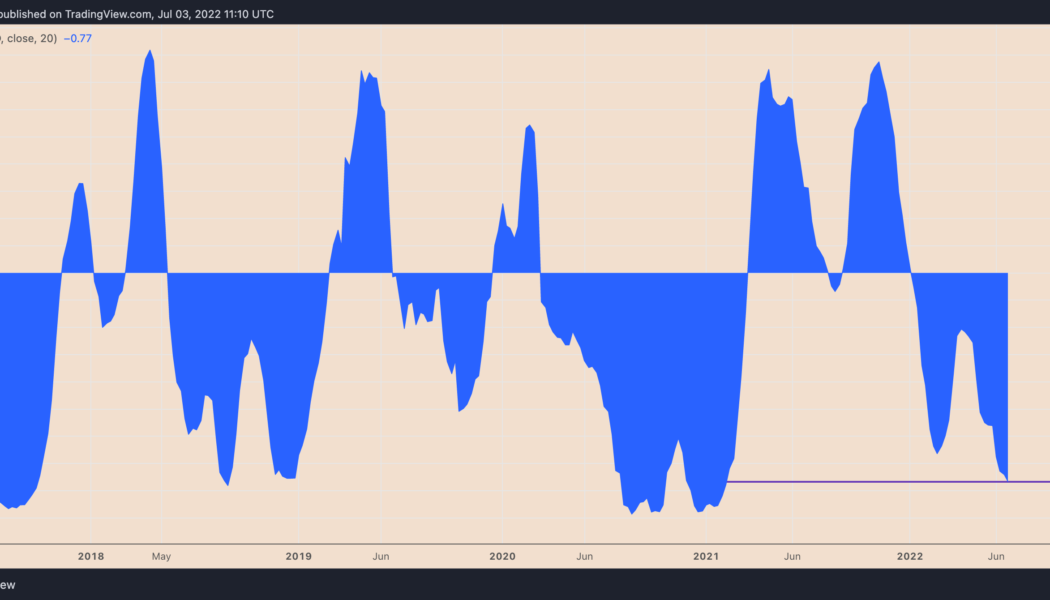
Bitcoin (BTC) has been moving in the opposite direction of the U.S. dollar since the beginning of 2022 — and now that inverse relationship is more extreme than ever. Bitcoin and the dollar go in opposite ways Notably, the weekly correlation coefficient between BTC and the dollar dropped to 0.77 below zero in the week ending July 3, its lowest in seventeen months. Meanwhile, Bitcoin’s correlation with the tech-heavy Nasdaq Composite reached 0.78 above zero in the same weekly session, data from TradingView shows. BTC/USD and U.S. dollar correlation coefficient. Source: TradingView That is primarily because of these markets’ year-to-date performances amid the fears of recession, led by the Federal Reserve’s benchmark rate hikes to curb rising inflation. Bitcoin, for example,...
Can Cardano’s July hard fork prevent ADA price from plunging 60%?
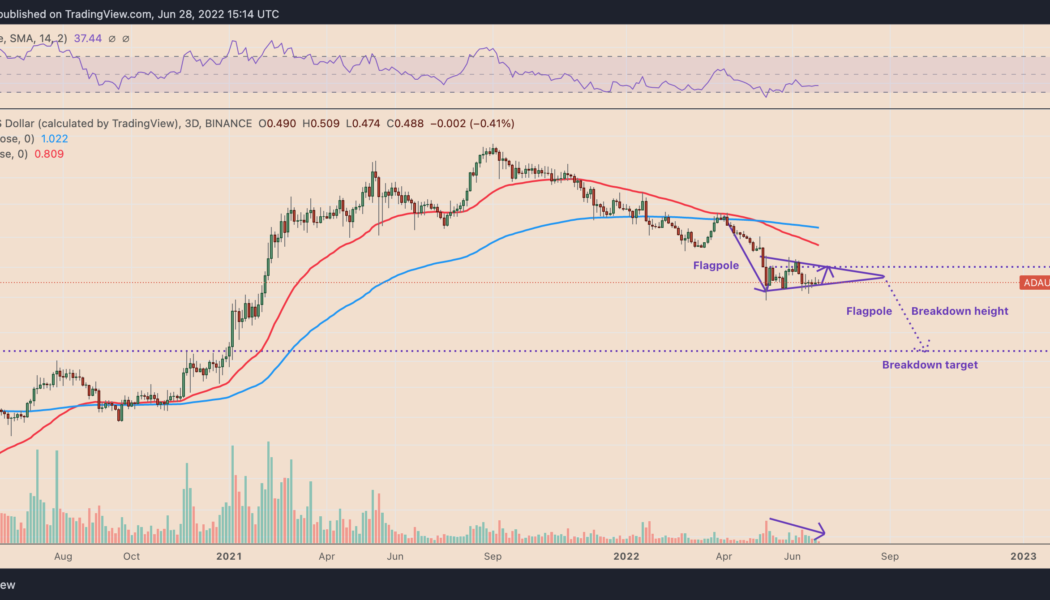
Cardano (ADA) has started painting a bearish continuation pattern on its longer-timeframe charts, raising its likelihood of undergoing a major price crash by August. ADA price in danger of a 60% plunge Dubbed the “bear pennant,” the pattern forms when the price consolidates inside a range defined by a falling trendline resistance and rising trendline support after a strong move downside. Additionally, the consolidation moves accompany a decrease in trading volumes. Bear pennants typically resolve after the price breaks below their trendline support and, as a rule, could fall by as much as the height of the previous big downtrend, called a “flagpole,” as illustrated in the chart below. ADA/USD three-day price chart featuring “bear pennant'”setup. So...
How low can Ethereum price drop versus Bitcoin amid the DeFi contagion?
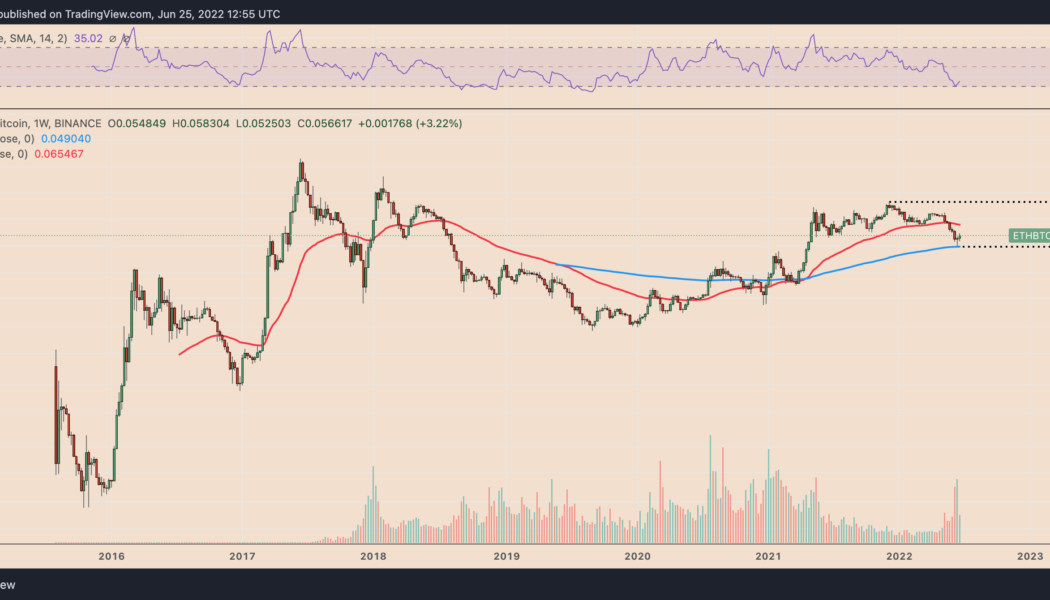
Ethereum’s native token Ether (ETH) has declined by more than 35% against Bitcoin (BTC) since December 2021 with a potential to decline further in the coming months. ETH/BTC weekly price chart. Source: TradingView ETH/BTC dynamics The ETH/BTC pair’s bullish trends typically suggest an increasing risk appetite among crypto traders, where speculation is more focused on Ether’s future valuations versus keeping their capital long-term in BTC. Conversely, a bearish ETH/BTC cycle is typically accompanied by a plunge in altcoins and Ethereum’s decline in market share. As a result, traders seek safety in BTC, showcasing their risk-off sentiment within the crypto industry. Ethereum TVL wipe-out Interest in the Ethereum blockchain soared during the pandemic as developer...
XRP price rally stalls near key level that last time triggered a 65% crash
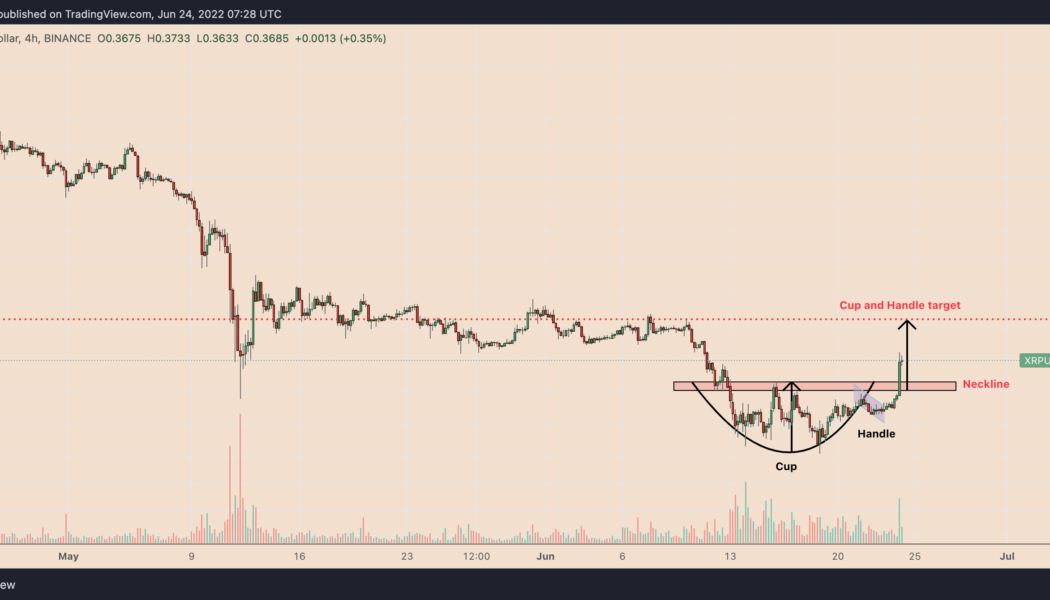
Ripple’s (XRP) ongoing upside retracement risks exhaustion as its price tests a resistance level with a history of triggering a 65% price crash. XRP price rebounds 30% XRP’s price gained nearly 30%, rising to $0.36 on June 24, four days after rebounding from $0.28, its lowest level since January 2021. The token’s retracement rally could extend to $0.41 next, according to its cup-and-handle pattern shown in the chart below. XRP/USD four-hour price chart featuring “cup and handle” pattern. Source: TradingView Interestingly, the indicator’s profit target is the same as XRP’s 50-day exponential moving average (50-day EMA; the red wave). XRP/USD daily price chart featuring 50-day EMA upside target. Source: TradingView Major resistance hurdle The cup-and-handle bullis...
Ethereum price breaks out as ‘bad news is good news’ for stocks
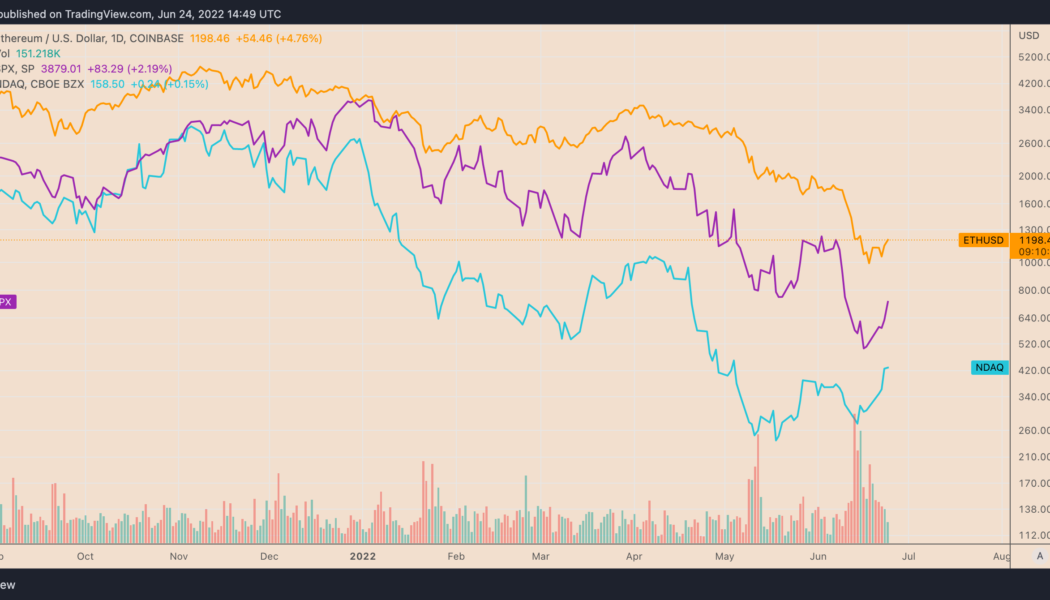
Ethereum’s native token, Ether (ETH), gained alongside riskier assets as investors assessed weak U.S. economic data and its potential to cool down rate hike fears. Ether mirrors risk-on recovery ETH’s price climbed up to 8.31% on June 24 to $1,225, six days after falling below $880, its lowest level since January 2021. Overall, the upside retracement brought bulls 40% in gains, raising anticipation about an extended recovery in the future while alleviating fears of a “clean fakeout.” For instance, independent market analyst “PostyXBT” projected ETH’s price to close above $1,300 by the end of June. In contrast, analyst “Wolf” feared that bears would attempt to “push price back to $1,047,” albeit anticipating a run-up to...
Polygon price jumps 60% in four days amid ‘pretty big’ MATIC accumulation
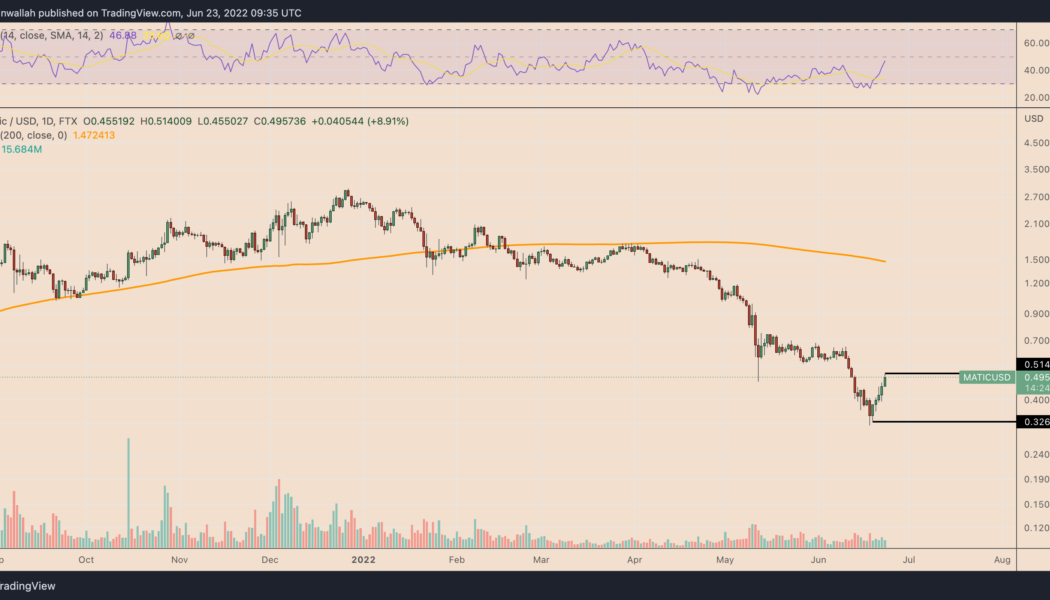
Polygon (MATIC) took a break from its prevailing bearish course, posting one of sharpest rebound in the crypto market this week. Notably, MATIC’s price has risen to $0.50 this June 23, four days after hitting $0.317, its lowest level since April 2021. This amounts to roughly a 60% gain, surpassing the performances of even Bitcoin (BTC) and Ether (ETH) in the same timeframe. MATIC/USD daily price chart. Source: TradingView Nevertheless, MATIC is still down significantly from its December 2021 high of $2.92, coinciding with the overall crypto bear market and a hawkish Fed putting pressure on risk-on assets. MATIC “in a pretty big accumulation” Meanwhile, some of its richest investors have been accumulating MATIC tokens despite the general downtrend, on-chain dat...
Ethereum risks another 60% drop after breaking below $1K to 18-month lows
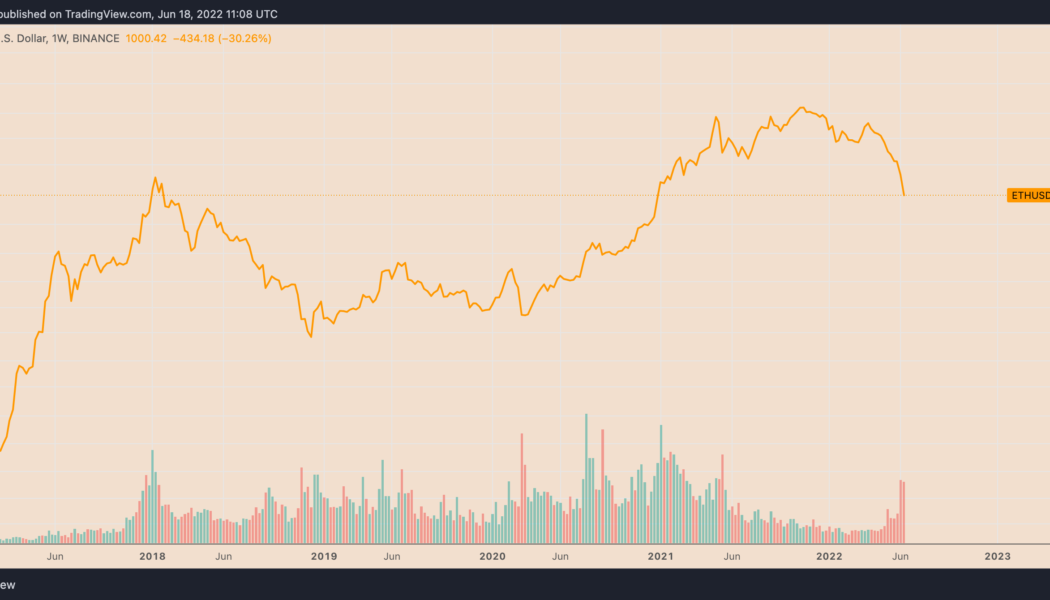
The price of Ethereum’s native token, Ether (ETH), careened below $1,000 on June 18 as the ongoing sell-off in the crypto market continued despite the weekend. Ether reached $975, its lowest level since January 2021, losing 80% of its value from its record high in November 2021. The decline appeared amid concerns about the Federal Reserve’s 75 basis points rate hike, a move that pushed both cryptocurrencies and stocks into a strong bear market. “The Federal Reserve has barely started raising rates, and for the record, they haven’t sold anything on their balance sheet either,” noted Nick, an analyst at data resource Ecoinometrics, warnings that “there is bound to be more downside coming.” ETH/USD weekly price chart. Source: TradingView Ethereum...
Stablecoins highlight ‘structural fragilities’ of crypto — Federal Reserve
The Federal Reserve’s board of governors pointed to stablecoins as a potential risk to financial stability amid a volatile crypto market. In its Monetary Policy Report released on Friday, the board of governors of the Federal Reserve System said “the collapse in the value of certain stablecoins” — likely referring to TerraUSD (UST) becoming unpegged from the United States dollar in May — in addition to “recent strains” in the digital asset market suggested “structural fragilities.” The government department pointed to the President’s Working Group on Financial Markets report from November 2021, in which officials said legislation was “urgently needed” to address financial risks. “Stablecoins that are not backed by safe and sufficiently liquid assets and are not subject to appro...
Bitcoin bounces 8% from lows amid warning BTC price bottom ‘shouldn’t be like that’
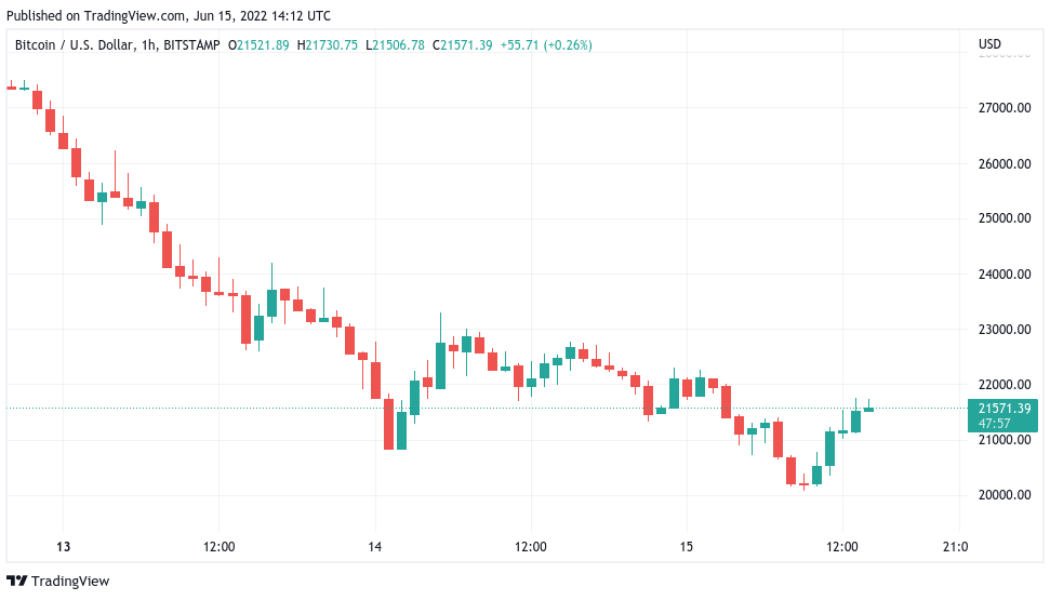
Bitcoin (BTC) spared hodlers the pain of losing $20,000 on June 15 after BTC/USD came dangerously close to last cycle’s high. BTC/USD 1-hour candle chart (Bitstamp). Source: TradingView Bitcoin “bottom” fools nobody Data from Cointelegraph Markets Pro and TradingView showed BTC/USD surging higher after reaching $20,079 on Bitstamp. In a pause from its sell-off, the pair followed United States equities higher on the Wall Street open, hitting $21,700. The S&P 500 gained 1.4% after the opening bell, while the Nasdaq Composite Index managed 1.6%. The renewed market strength, commentators said, was thanks to the majority already pricing in outsized key rate hikes by the Federal Reserve, due to be confirmed on the day. Nonetheless, it was crypto taking the worst hit in...
Ethereum crashed by 94% in 2018 — Will history repeat with ETH price bottoming at $375?
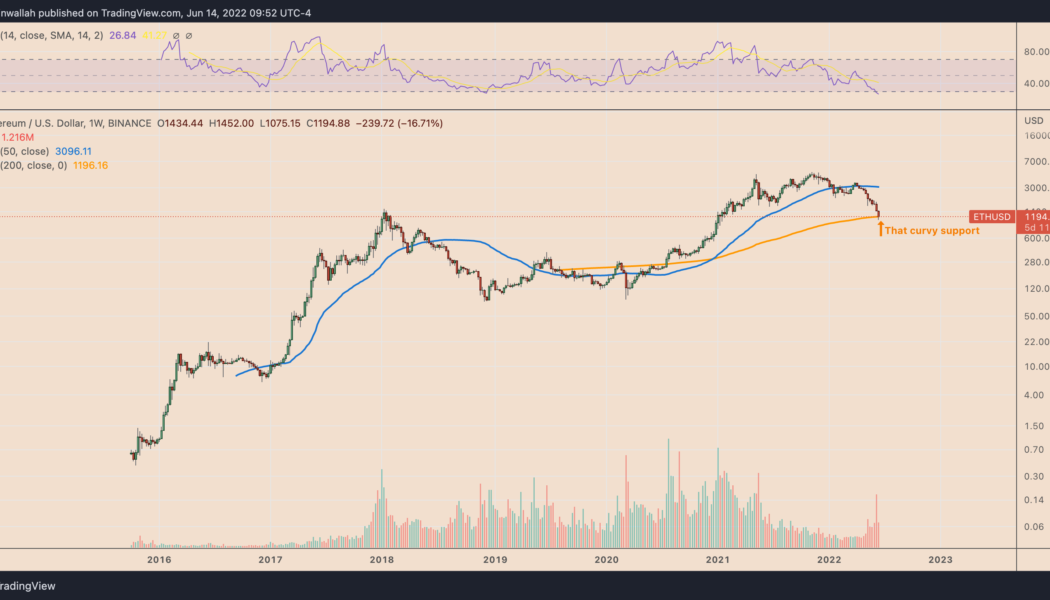
Ethereum’s native token Ether (ETH) is showing signs of bottoming out as ETH price bounced off a key support zone. Notably, ETH price is now holding above the key support level of the 200-week simple moving average (SMA) near $1,196. The 200-week SMA support seems purely psychological, partly due to its ability to serve as bottom levels in the previous Bitcoin bear markets. Independent market analyst “Bluntz” argues that the curvy level would also serve as a strong price floor for Ether where accumulation is likely. He notes: “BTC has bottomed 4x at the 200wma dating back to 2014. [Probably] safe to assume it’s a pretty strong level. Sure we can wick below it, but there [are] also six days left in the week.” ETH/USD weekly pric...
Ethereum price enters ‘oversold’ zone for the first time since November 2018
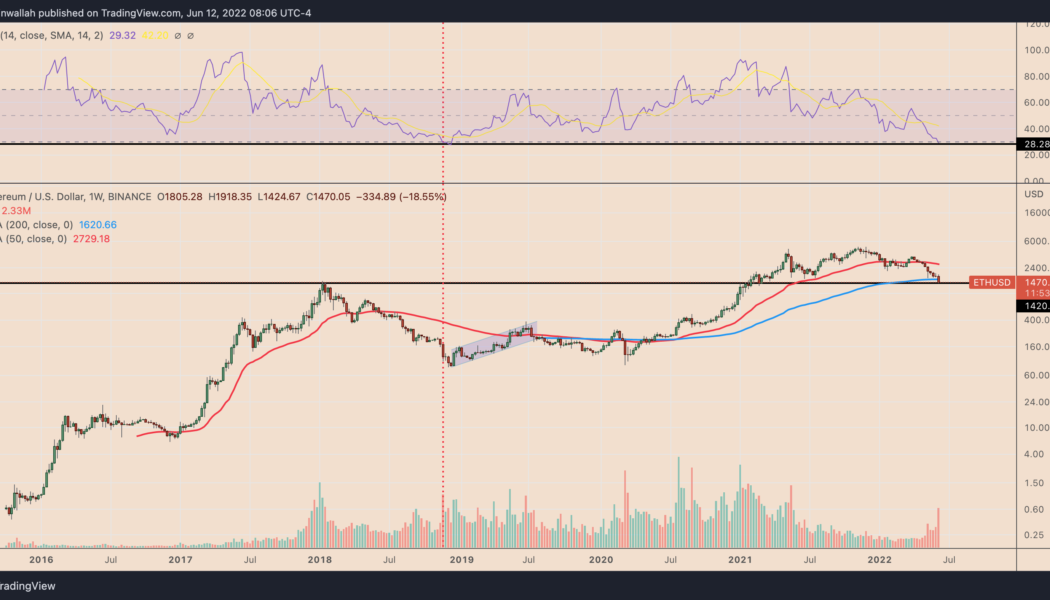
Ethereum’s native token Ether (ETH) entered its “oversold” territory this June 12, for the first time since November 2018, according to its weekly relative strength index (RSI). This is the last time $ETH went oversold on the weekly (hasn’t confirmed here yet). I had no followers, but macro bottom ticked it. Note, you can push way lower on weekly rsi, not trying to catch a bottom. https://t.co/kLCynTKTcS — The Wolf Of All Streets (@scottmelker) June 12, 2022 ETH eyes oversold bounce Traditional analysts consider an asset to be excessively sold after its RSI reading fall below 30. Furthermore, they also see the drop as an opportunity to “buy the dip,” believing an oversold signal would lead to a trend reversal. Ether’s previous oversold reading appeared i...
