Federal Reserve
New year, same ‘extreme fear’ — 5 things to watch in Bitcoin this week
Bitcoin (BTC) begins its first full week of 2022 in familiar territory below $50,000. After ending December at $47,200 — far below the majority of bullish expectations — the largest cryptocurrency has a lot to live up to as signs of a halving cycle peak remain nowhere to be found. With Wall Street set to return after stocks conversely ended the year on a high, inflation rampant and interest rate hikes looming, 2022 could soon turn out to be an interesting market environment, analysts say. So far, however, all is calm — BTC/USD has produced no major surprises for weeks on end. Cointelegraph takes a look at what could change — or continue — the status quo in the coming days. Stocks could see 6 months of “up only” Look no further than the S&P 500 for an example of the state of...
What BTC price slump? Bitcoin outperforms stocks and gold for 3rd year in a row
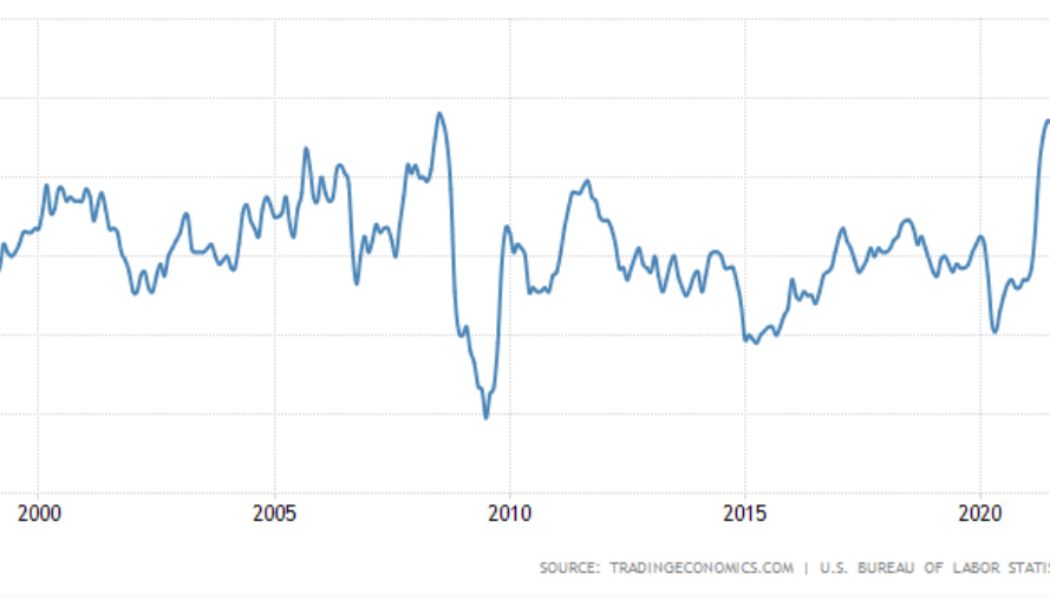
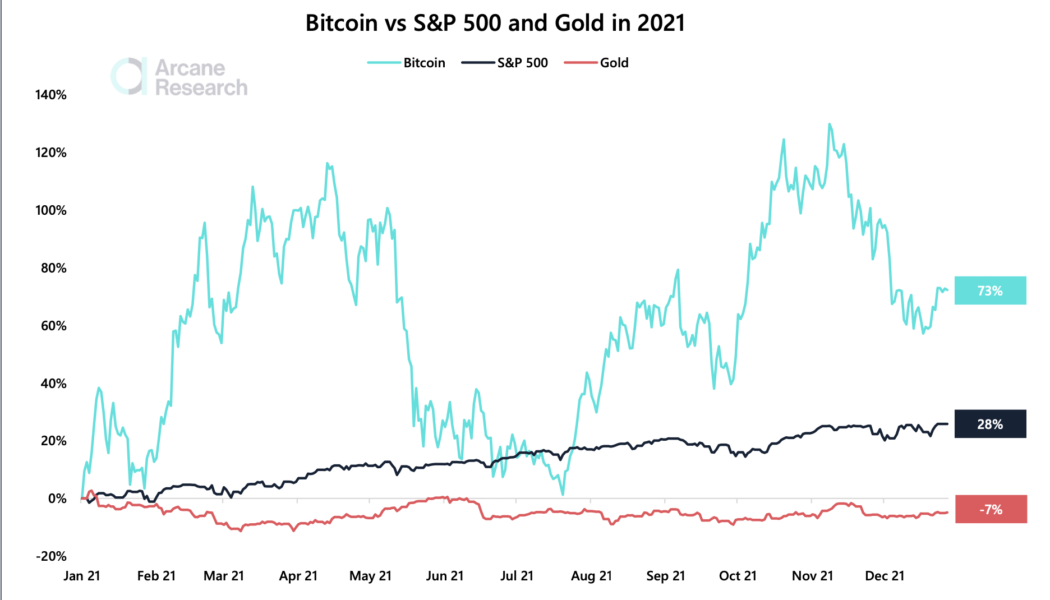
Bitcoin (BTC) may be down over 30% from its record high of $69,000, but it has emerged as one of the best-performing financial assets in 2021. BTC has bested the United States benchmark index the S&P 500 and gold. Arcane Research noted in its new report that Bitcoin’s year-to-date performance came out to be nearly 73%. In comparison, the S&P 500 index surged 28%, and gold dropped by 7% in the same period, which marks the third consecutive year that Bitcoin has outperformed the two. Bitcoin vs. S&P 500 vs. gold in 2021. Source: Arcane Research, TradingView At the core of Bitcoin’s extremely bullish performance was higher inflation. The U.S. consumer price index (CPI) logged its largest 12-month increase in four decades this November. “Most economists didn’t see the hig...
Bitcoin rises above $51K as the dollar flexes muscles against the euro
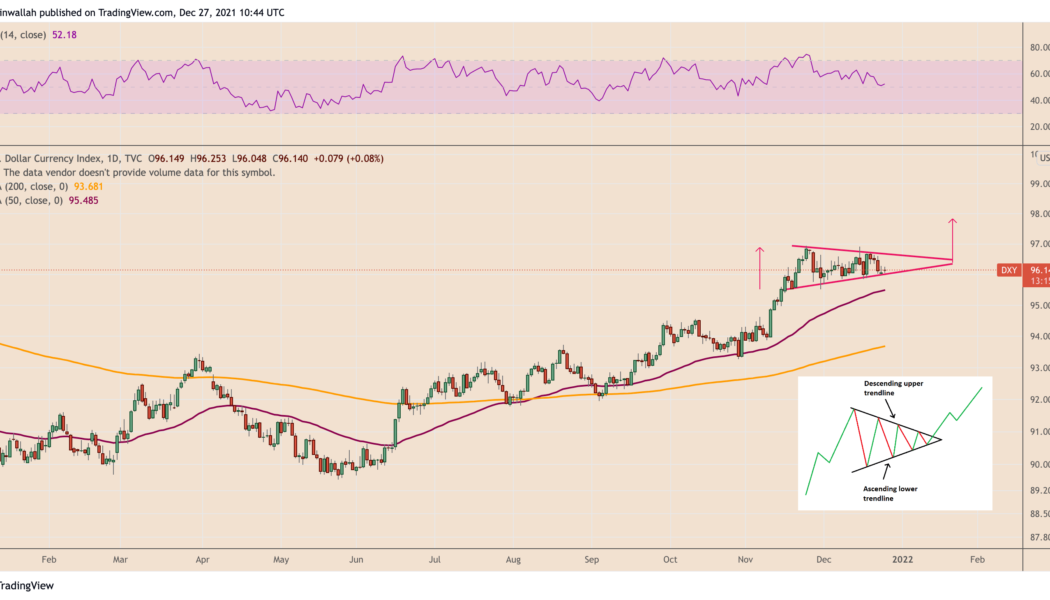
Bitcoin (BTC) regained its bullish strength after reclaiming $50,000 last week and continued to hold the psychological level as support on Dec. 27. Meanwhile, its rival for the top safe-haven spot, the U.S. dollar, also bounced off a critical price floor, hinting that it would continue rallying through into 2022. Triangle breakout The U.S. dollar index (DXY), which measures the greenback’s strength against a basket of top foreign currencies, has been trending towards the apex of a “symmetrical triangle” pattern on its daily chart. In doing so, the index has been treating the structure’s lower trendline as its solid support level, thus hinting that its next breakout would resolve to the upside. DXY daily price chart featuring symmetrical triangle setup. Source: Tradi...
Crypto Biz: All I want for Christmas is Bitcoin, Dec. 9–16
On Wednesday, the United States Federal Reserve wrapped up its final policy meeting of 2021 by voting to keep interest rates at record lows. In doing so, the Fed set the stage for a series of interest rate hikes beginning in the spring, which will be accompanied by a more accelerated taper of its bond-buying program. While the Fed’s decision to reduce market liquidity could impact crypto investors in the short term, Bitcoin (BTC), Ether (ETH) and DeFi are carving out their own narratives heading into 2022. Those narratives could supersede the latest episode of central-bank tightening. Below is the concise version of the latest “Crypto Biz” newsletter. For a comprehensive breakdown of business developments over the last week, register for the full newsletter below. Block’s Cash App will all...
Fish food? Data shows retail investors are buying Bitcoin, whales are selling
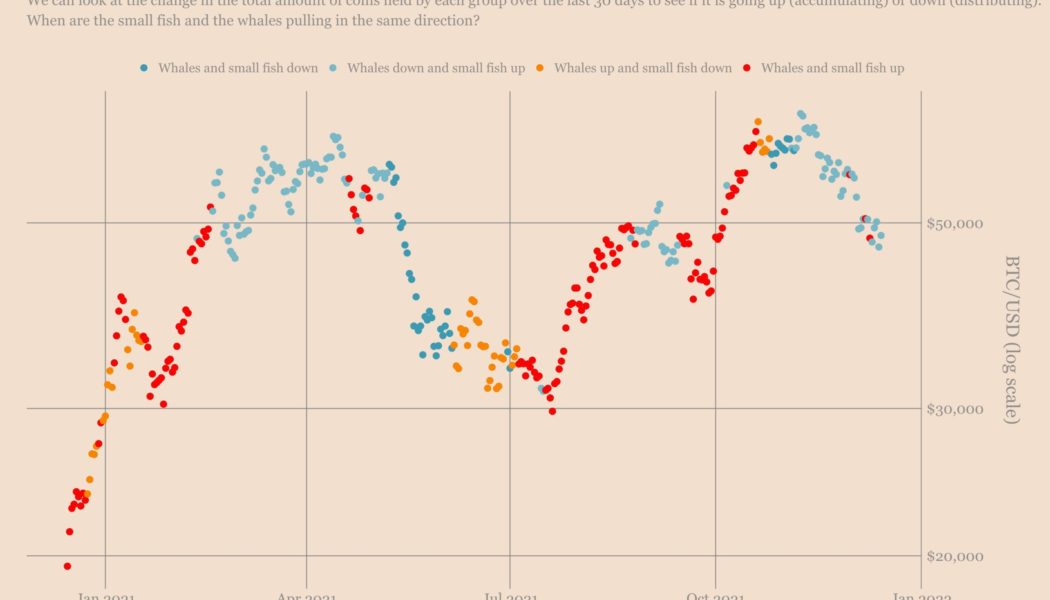
Bitcoin (BTC) staged an impressive recovery after dropping to its three-month low of $42,333 on Dec. 4, rising to as high as $51,000 since. The BTC price retracement primarily surfaced due to increased buying activity among addresses that hold less than 1 BTC. In contrast, the Bitcoin wallets with balances between 1,000 BTC and 10,000 BTC did little in supporting the upside move, data collected by Ecoinometrics showed. “Bitcoin is still stuck in a situation where small addresses are willing to stack sats [the smallest unit account of Bitcoin], while the whale addresses aren’t really accumulating,” the crypto-focused newsletter noted after assessing the change in Bitcoin amounts across small and rich wallet groups, as shown in the graph below. Bitcoin on-chain ...
Cardano’s ADA price eyes 30% rally with a potential ‘triple bottom’ setup
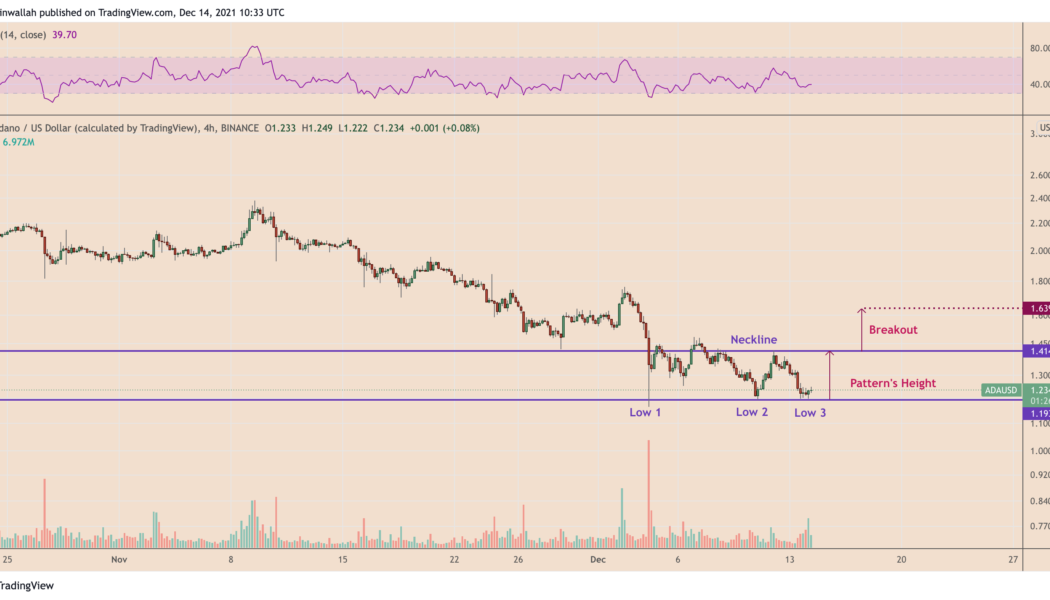
Cardano (ADA) may rally by nearly 30% in the coming days as it forms a classic bullish reversal pattern. Sharp ADA rebound underway Dubbed “triple bottom,” the pattern typically occurs at the end of a downtrend and consists of three consecutive lows printed roughly atop the same level. This means triple bottoms indicate sellers’ inability to break below a specific support level on three back-to-back attempts, which ultimately paves the way for buyers to take over. In a perfect scenario, the return of buyers to the market allows the instrument to retrace sharply toward a higher level, called the “neckline,” that connects the highs of the previous two rebounds. The move follows up with another breakout, this time taking the price higher by as much as the distance between the pattern’s bottom...
Bitcoin price slips below $47K as stocks, crypto prepare for this week’s FOMC meeting
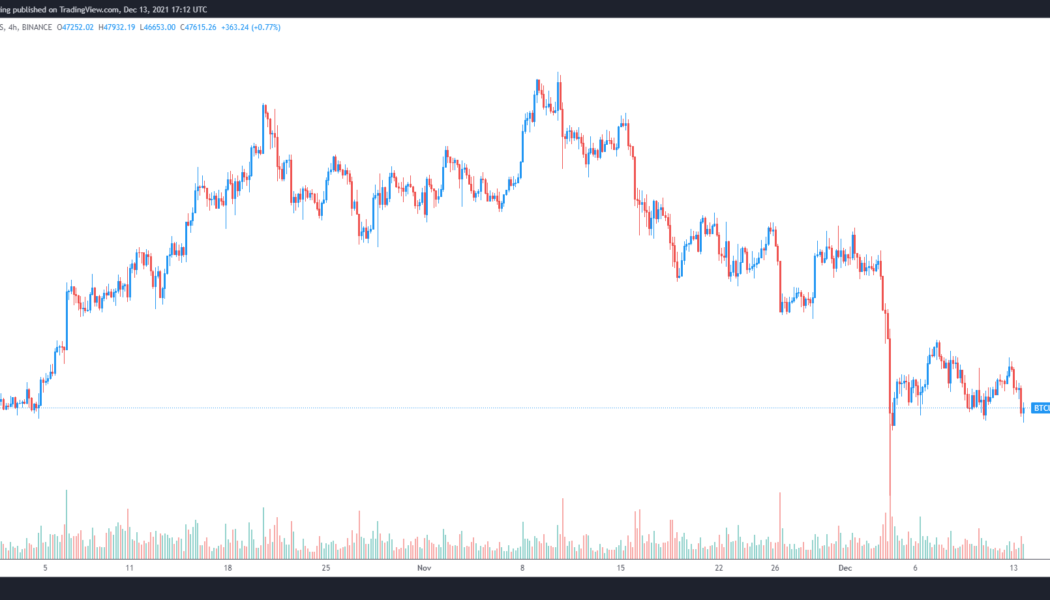
Bitcoin (BTC) bulls are once again on the defensive foot after the breakout momentum that put the price above $50,000 on the weekend evaporated and pulled the price under $47,000. Analysts say the slight pullback in equities markets and the upcoming Federal Open Market Committee (FOMC) meeting are the primary reasons for Dec. 13’s pullback and a few suggest that a revisit to the swing low at $42,000 could be on the cards. BTC/USDT 4-hour chart. Source: TradingView Here’s a look at what analysts are saying about the current Bitcoin price action and what they expect in the short term. Fed tapering talks put pressure on the market The current headwinds facing BTC are in large part being influenced by regulatory matters in the United States, as highlighted in a recent report from D...
3 reasons why Ethereum price can drop below $3K by the end of 2021
Ethereum’s native token Ether (ETH) reached an all-time high around $4,867 earlier in November, only to plunge by nearly 20% a month later on rising profit-taking sentiment. And now, as the ETH price holds $4,000 as a key support level, risks of further selloffs are emerging in the form of multiple technical and fundamental indicators. ETH price rising wedge First, Ether appears to have been breaking out of “rising wedge,” a bearish reversal pattern that emerges when the price trends upward inside a range defined by two ascending — but converging — trendlines. Simply put, as the Ether price nears the Wedge’s apex point, it risks breaking below the pattern’s lower trendline, a move that many technical chartists see as a cue for more losses ahead. In doing so, t...
