ETH USD
Ethereum risks another 60% drop after breaking below $1K to 18-month lows
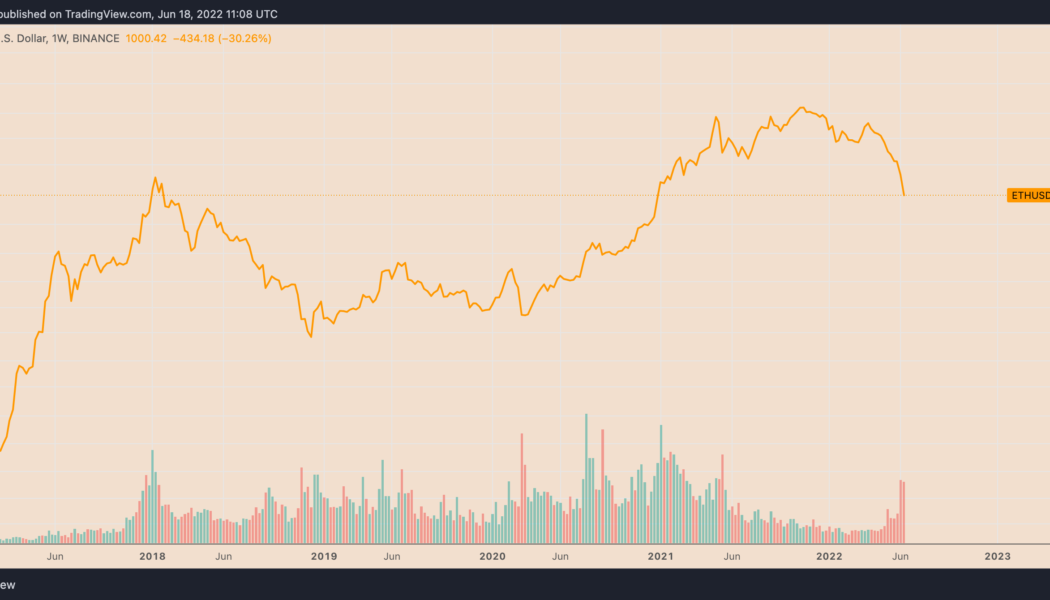
The price of Ethereum’s native token, Ether (ETH), careened below $1,000 on June 18 as the ongoing sell-off in the crypto market continued despite the weekend. Ether reached $975, its lowest level since January 2021, losing 80% of its value from its record high in November 2021. The decline appeared amid concerns about the Federal Reserve’s 75 basis points rate hike, a move that pushed both cryptocurrencies and stocks into a strong bear market. “The Federal Reserve has barely started raising rates, and for the record, they haven’t sold anything on their balance sheet either,” noted Nick, an analyst at data resource Ecoinometrics, warnings that “there is bound to be more downside coming.” ETH/USD weekly price chart. Source: TradingView Ethereum...
Ethereum crashed by 94% in 2018 — Will history repeat with ETH price bottoming at $375?
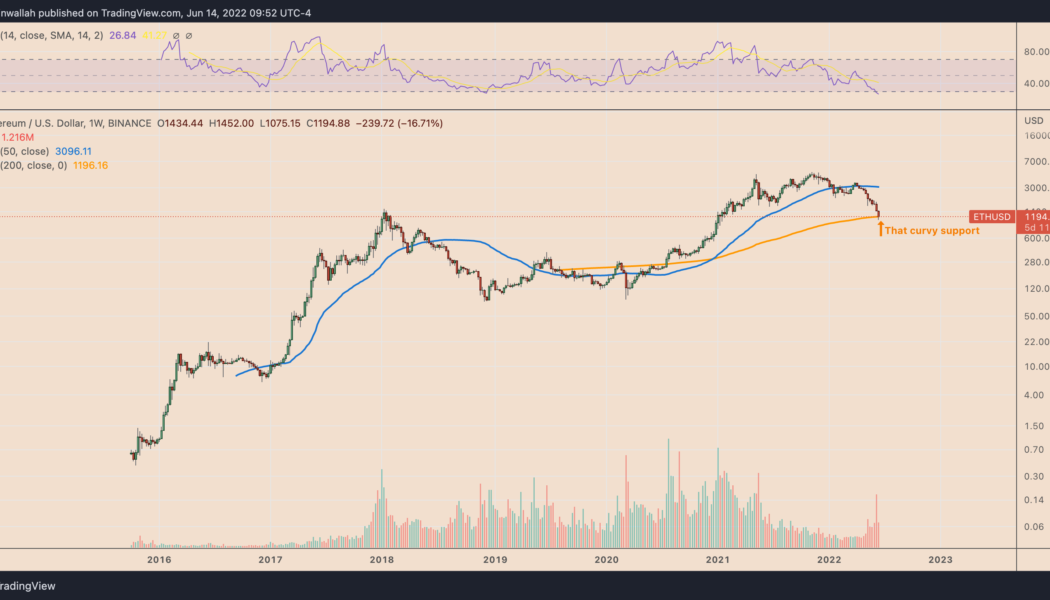
Ethereum’s native token Ether (ETH) is showing signs of bottoming out as ETH price bounced off a key support zone. Notably, ETH price is now holding above the key support level of the 200-week simple moving average (SMA) near $1,196. The 200-week SMA support seems purely psychological, partly due to its ability to serve as bottom levels in the previous Bitcoin bear markets. Independent market analyst “Bluntz” argues that the curvy level would also serve as a strong price floor for Ether where accumulation is likely. He notes: “BTC has bottomed 4x at the 200wma dating back to 2014. [Probably] safe to assume it’s a pretty strong level. Sure we can wick below it, but there [are] also six days left in the week.” ETH/USD weekly pric...
Ethereum price enters ‘oversold’ zone for the first time since November 2018
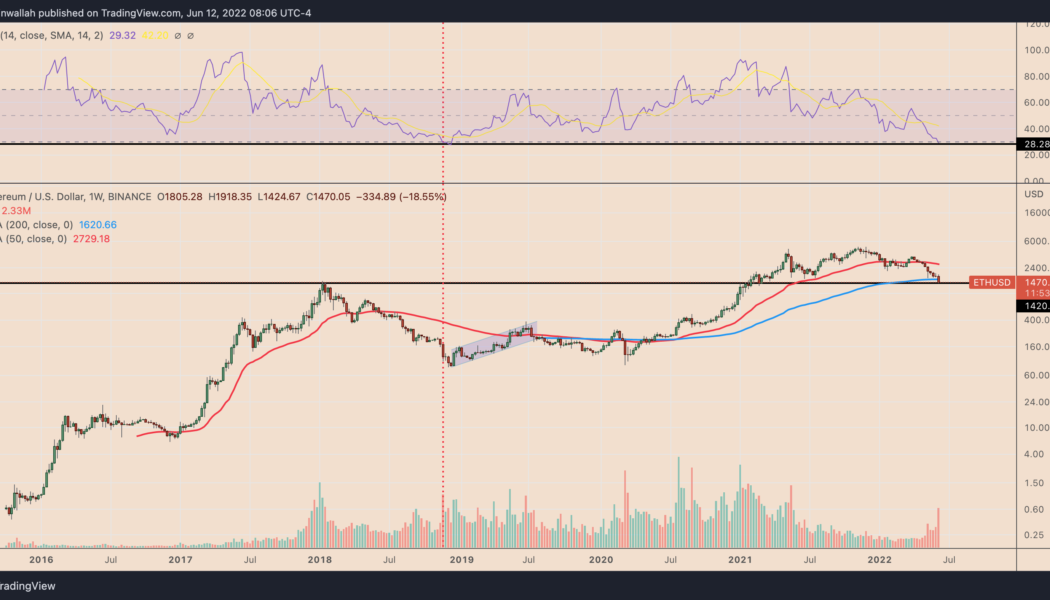
Ethereum’s native token Ether (ETH) entered its “oversold” territory this June 12, for the first time since November 2018, according to its weekly relative strength index (RSI). This is the last time $ETH went oversold on the weekly (hasn’t confirmed here yet). I had no followers, but macro bottom ticked it. Note, you can push way lower on weekly rsi, not trying to catch a bottom. https://t.co/kLCynTKTcS — The Wolf Of All Streets (@scottmelker) June 12, 2022 ETH eyes oversold bounce Traditional analysts consider an asset to be excessively sold after its RSI reading fall below 30. Furthermore, they also see the drop as an opportunity to “buy the dip,” believing an oversold signal would lead to a trend reversal. Ether’s previous oversold reading appeared i...
Ethereum eyes fresh yearly lows vs. Bitcoin as bulls snub successful ‘Merge’ rehearsal
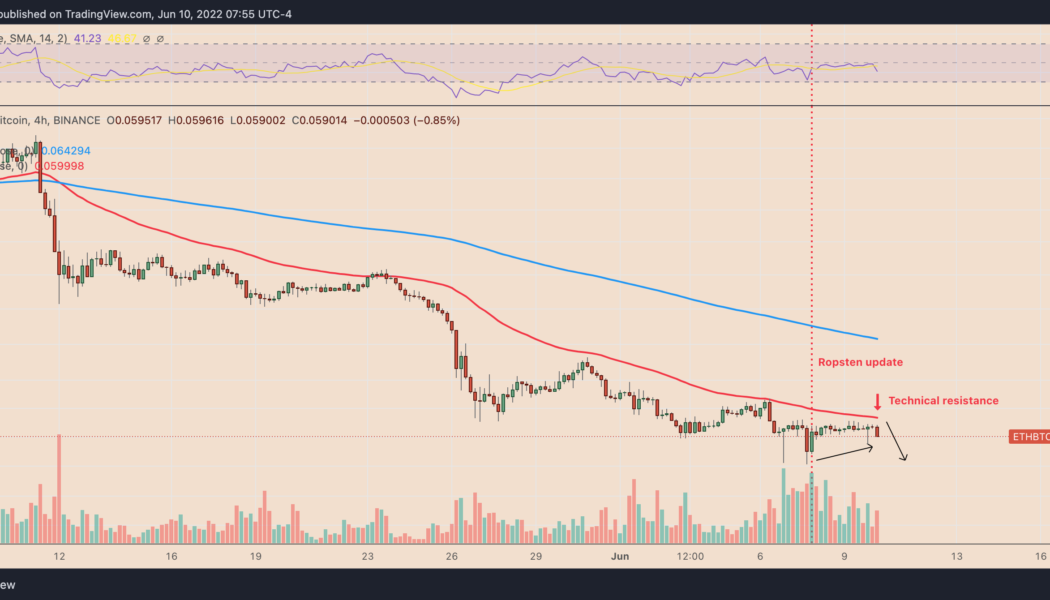
Ethereum’s native token Ether (ETH) resumed its decline against Bitcoin (BTC) two days after a successful rehearsal of its proof-of-stake (PoS) algorithm on its longest-running testnet “Ropsten.” The ETH/BTC fell by 2.5% to 0.0586 on June 10. The pair’s downside move came as a part of a correction that had started a day before when it reached a local peak of 0.0598, hinting at weaker bullish sentiment despite the optimistic “Merge” update. ETH/BTC four-hour price chart. Source: TradingView Interestingly, the selloff occurred near ETH/BTC’s 50-4H exponential moving average (50-4H EMA; the red wave) around 0.06. This technical resistance has been capping the pair’s bullish attempts since May 12, as shown in the chart above. Staked Ether behind ...
- 1
- 2


