ETH USD
Ethereum ‘shark’ accumulation, Shanghai hard fork put $2K ETH price in play
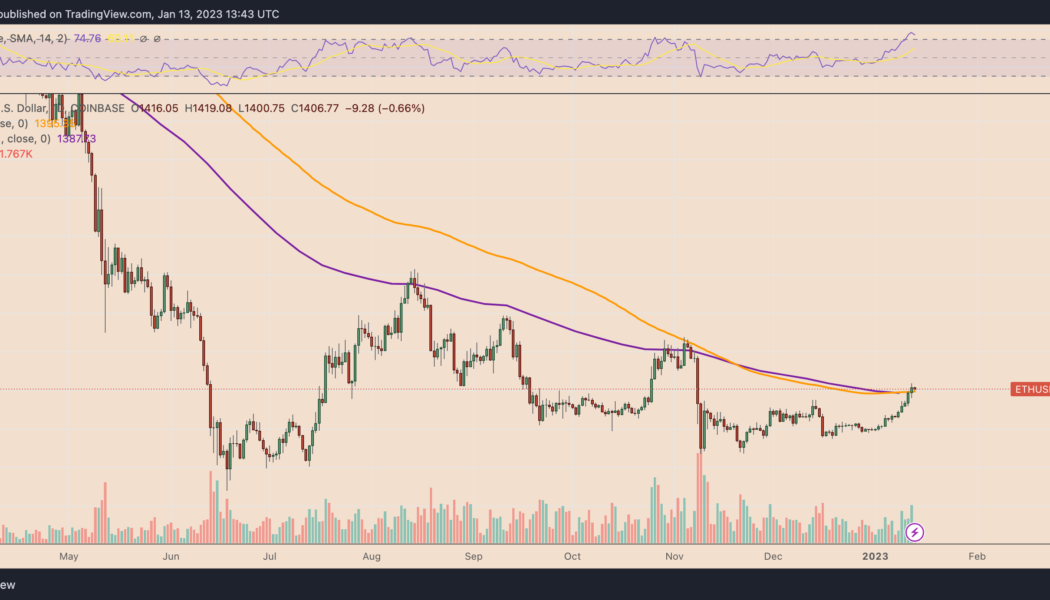
Ether (ETH) price technicals suggest that 35% gains are in play by March 2022 due to several bullish technical and fundamental factors. Ether price rises above two key moving averages On Jan. 8, Ether’s price crossed above its 21-week exponential moving average (21-week EMA; the purple wave) and 200-day simple moving average (200-day SMA; the orange wave). Historically, these two moving averages have separated bull and bear markets. When ETH’s price trades above them, it is considered to be in a bull market, and vice versa. ETH/USD daily price chart featuring 21-week EMA and 200-day SMA. Source: TradingView The last time Ether crossed above its 21-week EMA and 200-day SMA was in April 2022. But this was a fakeout, in part due to the collapse of Terra (LUNA) the following month. B...
Will ETH price crash to $750? Ethereum daily active addresses plunge to 4-month lows
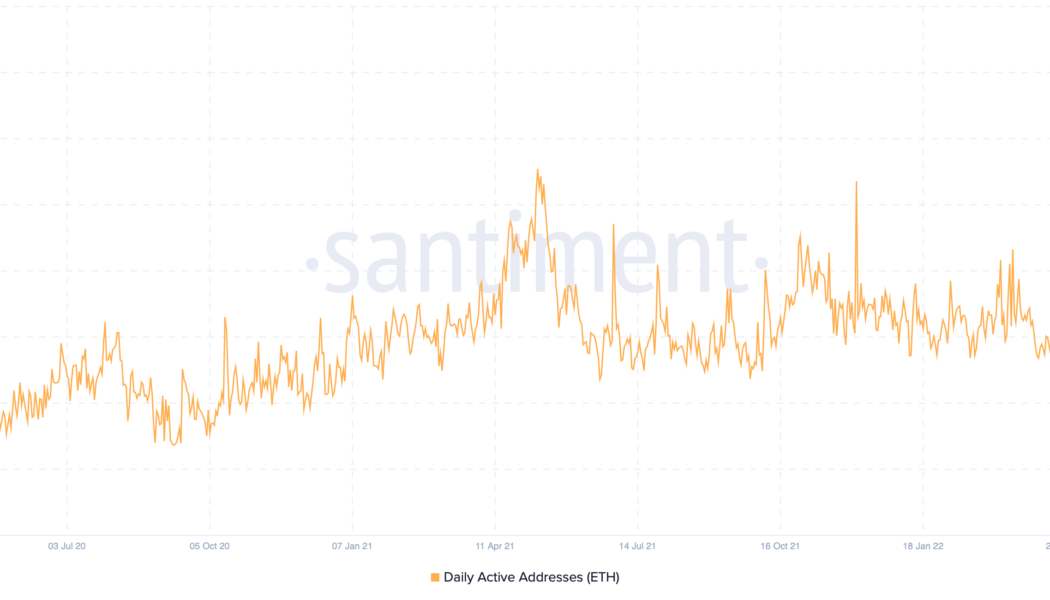
Ethereum has witnessed a substantial drop in its daily active address (DAA) count over the last four months, raising fears about more downside for Ether (ETH) price in the coming weeks. Stagnant Ethereum price spooks investors The number of Ether DAA dropped to 152,000 on Oct. 21, its lowest level since June, according to data provided by Santiment. In other words, the plunge showed fewer unique Ethereum addresses interacting with the network. Ethereum daily active address count on a daily timeframe. Source: Santiment Interestingly, the drop comes after Ether’s 80%-plus correction from its November 2021 high of around $4,850. This coincidence could mean two things: Ethereum users decided to leave the market and/or paused their interaction with the blockchain network after the market’s...
Ethereum risks another 10% drop versus Bitcoin as $15.4M exits ETH investment funds
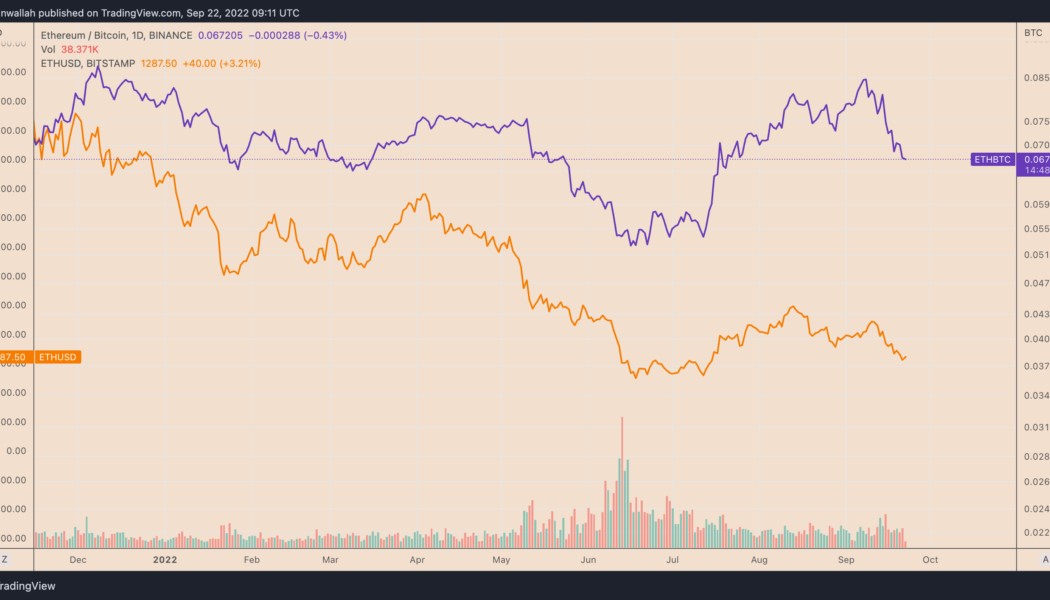
Ethereum’s Merge on Sep. 15 turned out to be a sell-the-news event, which looks set to continue. Notably, Ether (ETH) dropped considerably against the U.S. dollar and Bitcoin (BTC) after the Merge. As of Sep. 22, ETH/USD and ETH/BTC trading pairs were down by more than 20% and 17%, respectively, since Ethereum’s switch to Proof-of-Stake (PoS. ETH/USD and ETH/BTC daily price chart. Source: TradingView What’s eating Ether bulls? Multiple catalysts contributed to Ether’s declines in the said period. First, ETH’s price fall against the dollar appeared in sync with similar declines elsewhere in the crypto market, driven by Federal Reserve’s 75 basis points (bps) rate hike. Second, Ethereum faced a lot of flak for becoming too centralized ...
Ethereum miners dump 30K ETH, stonewalling ‘ultra sound money’ deflation narrative
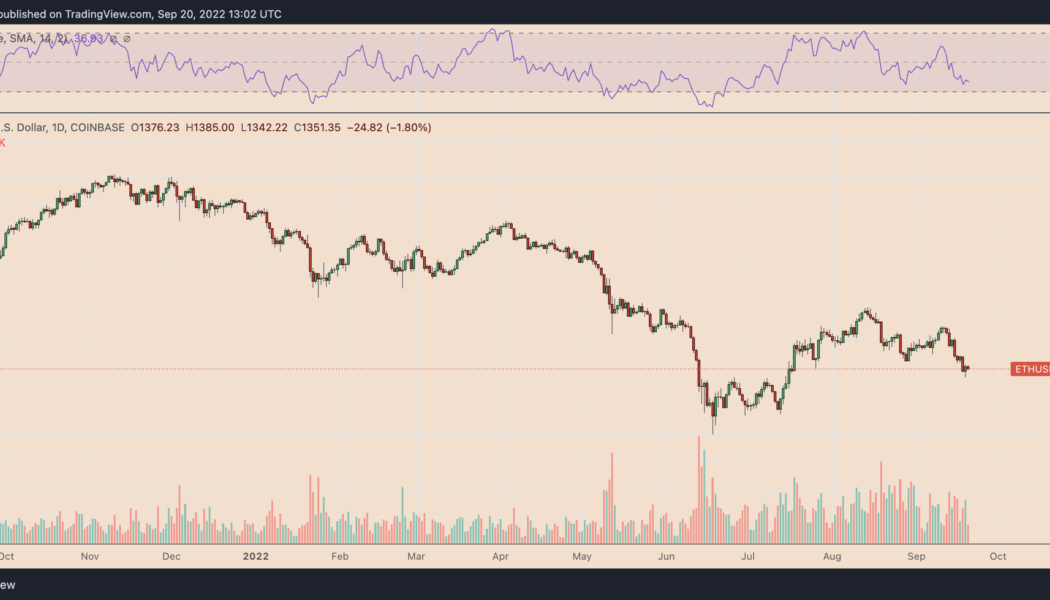
Ethereum’s switch to proof-of-stake (PoS) on Sept. 15 failed to extend Ether’s (ETH) upside momentum as ETH miners added sell pressure to the market. On the daily chart, ETH price declined from around $1,650 on Sept. 15 to around $1,350 on Sept. 20, an almost 16% drop. The ETH/USD pair dropped in sync with other top cryptocurrencies, including Bitcoin (BTC), amid worries about higher Federal Reserve rate hikes. ETH/USD daily price chart. Source: TradingView Ethereum remains inflationary The Ether price drop on Sept. 15 also coincided with an increase in ETH supply, albeit not immediately post-Merge. $ETH is now Ultra Sound Money pic.twitter.com/fKz6VmoWdR — DavidHoffman.eth (@TrustlessState) September 15, 2022 Roughly 24 hours later, the supply change flipped positi...
The floppening? Ethereum price weakens post-Merge, risking 55% drop against Bitcoin
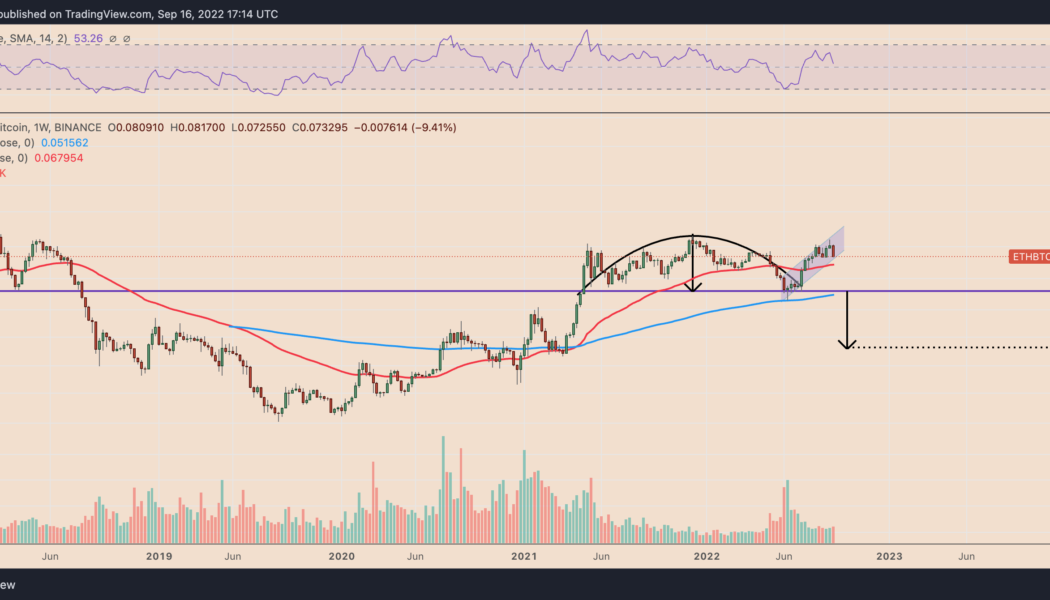
Ethereum’s native token Ether (ETH) has been forming an inverse-cup-and-handle pattern since May 2021 on the weekly chart, which hints at a potential decline against Bitcoin (BTC). ETH/BTC weekly price chart featuring inverse cup-and-handle breakdown setup. Source: TradingView An inverse cup-and-handle is a bearish reversal pattern, accompanied by lower trading volume. It typically resolves after the price breaks below its support level, followed by a fall toward the level at a length equal to the maximum height between the cup’s peak and the support line. Applying the theoretical definition on ETH/BTC’s weekly chart presents 0.03 BTC as its next downside target, down around 55% from Sept. 16’s price. Can ETH/BTC pull a Dow Jones? Alternatively, the ...
Surge or purge? Why the Merge may not save Ethereum price from ‘Septembear’
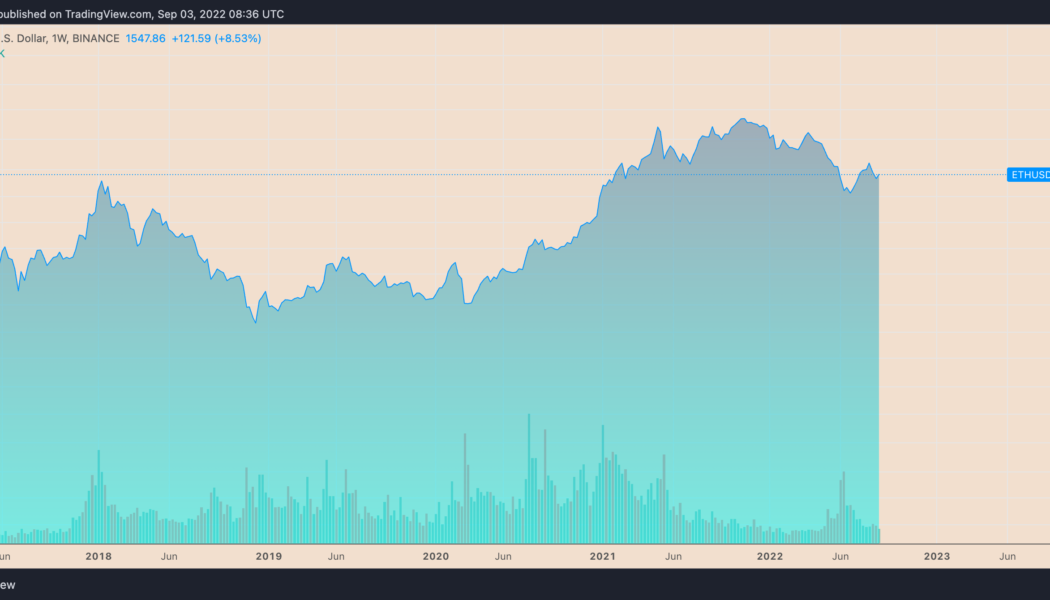
Ethereum’s native token, Ether (ETH), is not immune to downside risk in September after rallying approximately 90% from its bottom of around $880 in June. Much of the token’s upside move is attributed to the Merge, a technical upgrade that would make Ethereum a proof-of-stake (PoS) protocol, slated for Sep. 15. But despite logging impressive gains between June and September, Ether still trades almost 70% below its record high of around $4,950 from November 2021. Therefore, its possibility of heading lower remains on the cards. ETH/USD weekly price chart. Source: TradingView Here are three Ethereum bearish market indicators that show why more downside is likely. Sell the Ethereum Merge news Ethereum options traders anticipate Ether’s price to reach $2,200 f...
Ethereum price rises by 50% against Bitcoin in one month — but there’s a catch
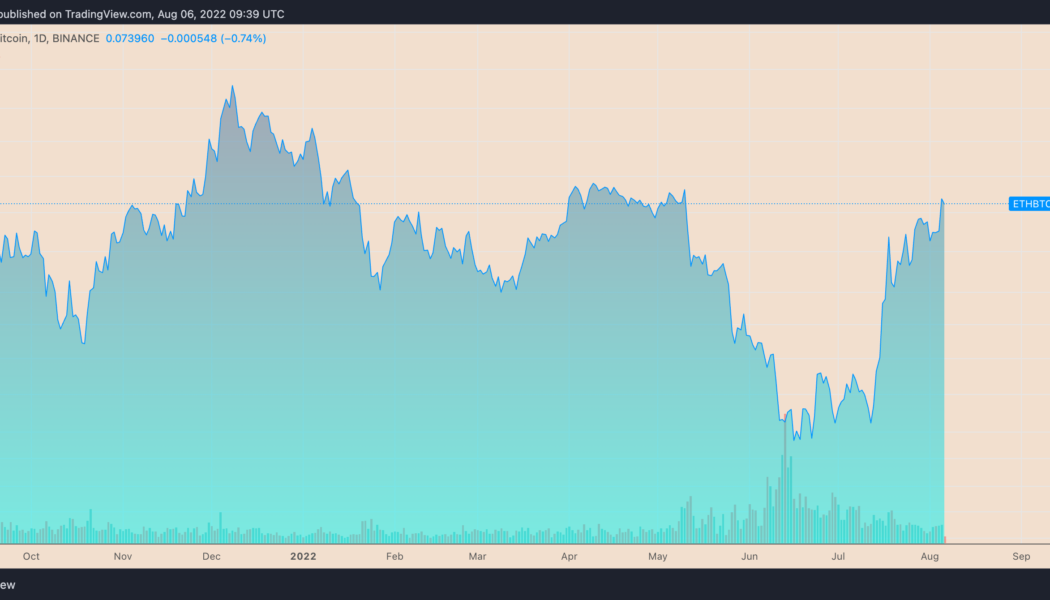
Ether (ETH), Ethereum’s native toke, has been continuing its uptrend against Bitcoin (BTC) as euphoria around its upcoming network upgrade, “the Merge,” grows. ETH at multi-month highs against BTC On the daily chart, ETH/BTC surged to an intraday high of 0.075 on Aug. 6, following a 1.5% upside move. Meanwhile, the pair’s gains came as a part of a broader rebound trend that started a month ago at 0.049, amounting to approximately 50% gains. ETH/BTC daily price chart. Source: TradingView The ETH/BTC recovery in part has surfaced due to the Merge, which will have Ethereum switch from proof-of-work (PoW) mining to proof-of-stake (PoS). Ethereum’s “rising wedge” suggests sell-off From a technical perspective, Ether stares at potential interim loss...
Ethereum’s bearish U-turn? ETH price momentum fades after $1.6K rejection
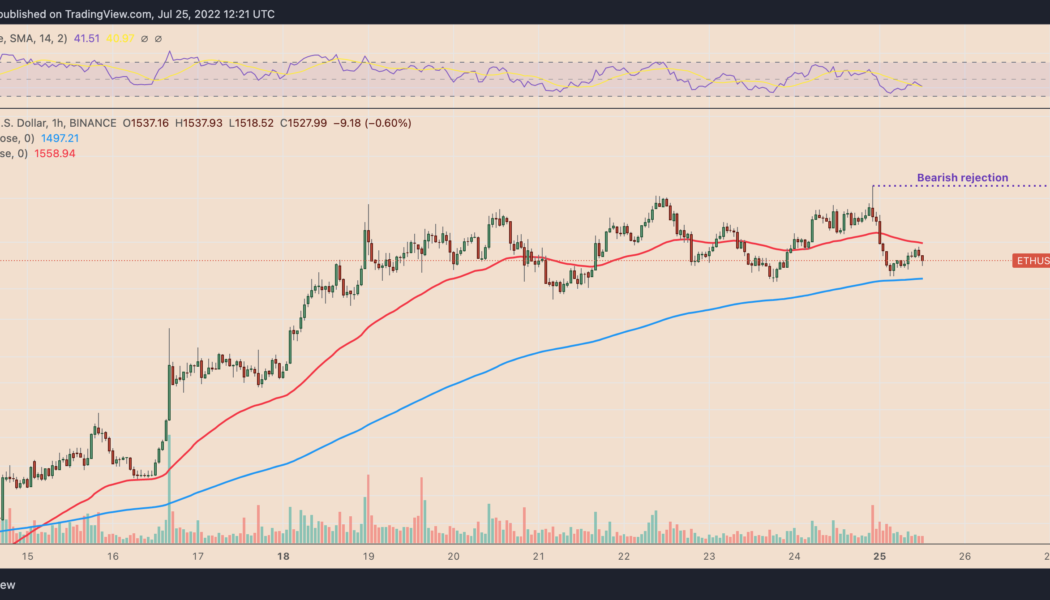
Ethereum’s native token Ether (ETH) tumbled on July 26, reducing hopes of an extended price recovery. The ETH/USD pair dropped by roughly 5%, followed by a modest rebound to over $1,550. Ethereum gets rejected at $1,650 These overnight moves liquidated over $80 million worth of Ether positions in the last 24 hours, data from CoinGlass reveals. ETH/USD hourly price chart. Source: TradingView The seesaw action also revealed an underlying bias conflict among traders who have been stuck between two extremely opposite market fundamentals. The first is the euphoria surrounding Ethereum’s potential transition to proof-of-stake in September, which has helped Ether’s price to recover 45% month-to-date. However, this bullish hype is at odds with macroeconomic headwinds, namel...
Ethereum Classic soars 100% in nine days outperforming ETH as ‘the Merge’ approaches
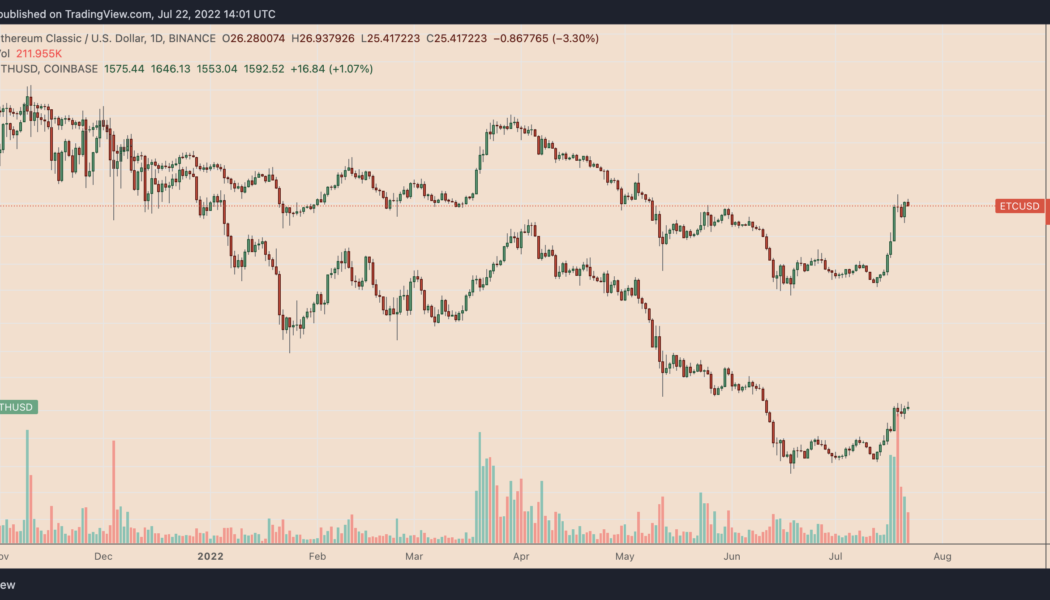
Ethereum Classic (ETC) has been outperforming its arch-rival Ethereum’s native token Ether (ETH) during the current crypto market rebound with the ETC/ETH pairs at 10-month highs. Why is ETC beating ETH? ETC’s price has risen to $27 on July 22, amounting to a 100% gain in nine days after bottoming out at $13.35. Comparatively, ETH’s price has seen a 64% rally in U.S. dollar terms. ETC/USD versus ETH/USD daily price chart. Source: TradingView Ethereum’s rebound has been among the sharpest among the top cryptocurrencies, primarily due to the euphoria surrounding its potential network upgrade in September. Dubbed “the Merge,” the long-awaited technical update will switch Ethereum from proof-of-work (PoW) to proof-of-stake (PoS). Anyone who believes the #Eth...
Ethereum traders gauge fakeout risks after 40% ETH price rally
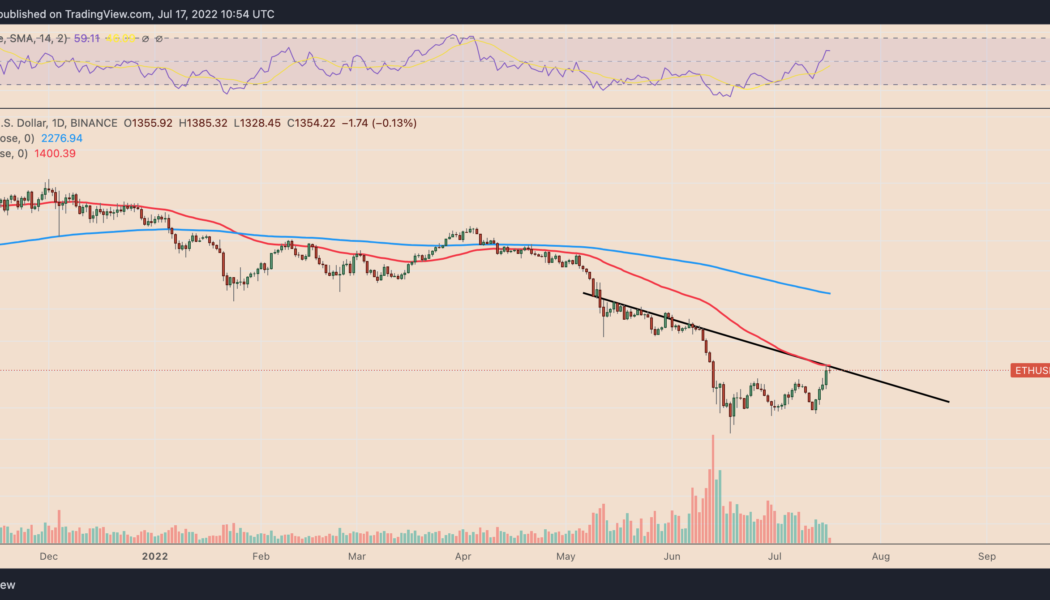
Ethereum’s native token Ether (ETH) saw a modest pullback on July 17 after ramming into a critical technical resistance confluence. Merge-led Ethereum price breakout ETH’s price dropped by 1.8% to $1,328 after struggling to move above two strong resistance levels: the 50-day exponential moving average (5-day EMA; the red wave) and a descending trendline (black) serving as a price ceiling since May. ETH/USD daily price chart. Source: TradingView Previously, Ether rallied by over 40% from $1,000 on July 13 to over $1,400 on July 16. The jump appeared partly due to euphoria surrounding “the Merge” slated for September. Meanwhile, a golden cross’s appearance on Ethereum’s four-hour chart also boosted Ether’s upside sentiment among technical a...
Terra’s LUNA2 skyrockets 70% in nine days despite persistent sell-off risks
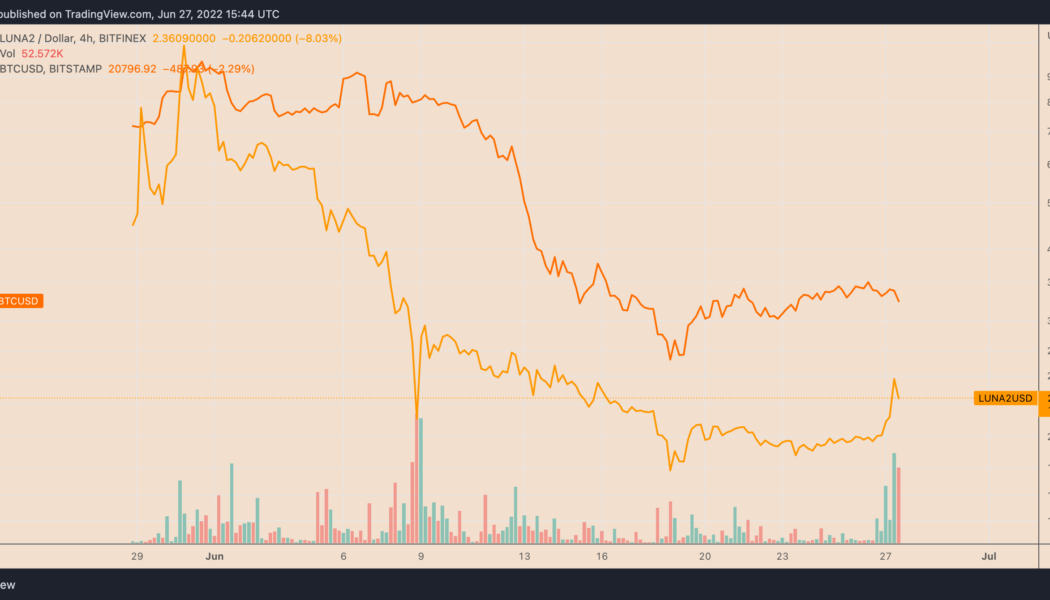
The price of Terra (LUNA2) has recovered sharply nine days after falling to its historic lows of $1.62. On June 27, LUNA2’s rate reached $2.77 per token, thus chalking up a 70% recovery when measured from the said low. Still, the token traded 77.35% lower than its record high of $12.24, set on May 30. LUNA2’s recovery mirrored similar retracement moves elsewhere in the crypto industry with top crypto assets Bitcoin (BTC) and Ether (ETH) rising by approximately 25% and 45% in the same period. LUNA2/USD four-hour price chart versus BTC/USD. Source: TradingView LUNA2 price rally could trap bulls The recent bout of buying in the LUNA2 market could trap bulls, given it has come as a part of a broader correction trend. In detail, LUNA2 appears to be forming a “bear flag&#...
How low can Ethereum price drop versus Bitcoin amid the DeFi contagion?
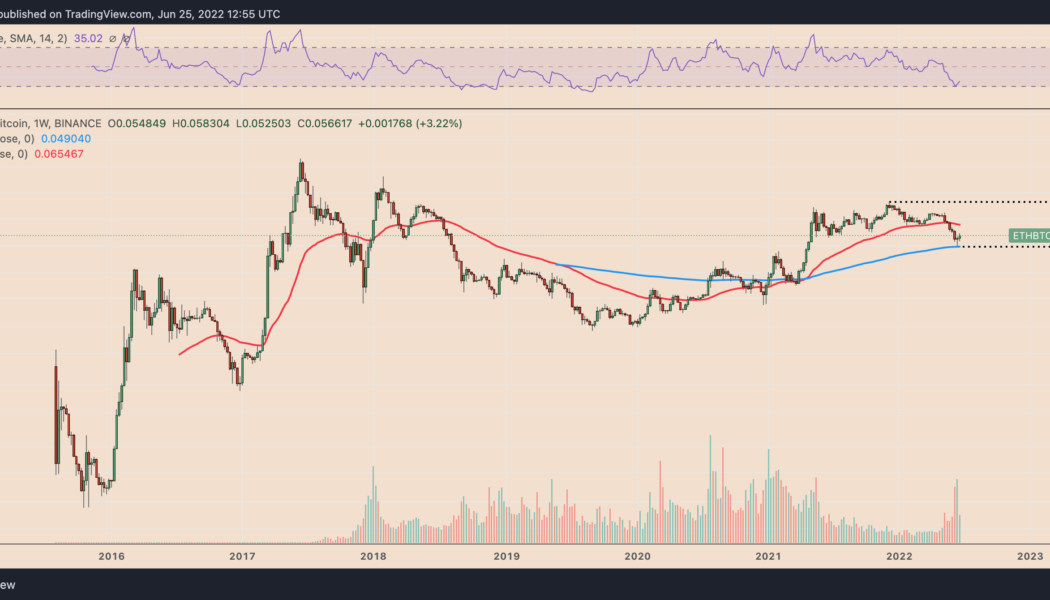
Ethereum’s native token Ether (ETH) has declined by more than 35% against Bitcoin (BTC) since December 2021 with a potential to decline further in the coming months. ETH/BTC weekly price chart. Source: TradingView ETH/BTC dynamics The ETH/BTC pair’s bullish trends typically suggest an increasing risk appetite among crypto traders, where speculation is more focused on Ether’s future valuations versus keeping their capital long-term in BTC. Conversely, a bearish ETH/BTC cycle is typically accompanied by a plunge in altcoins and Ethereum’s decline in market share. As a result, traders seek safety in BTC, showcasing their risk-off sentiment within the crypto industry. Ethereum TVL wipe-out Interest in the Ethereum blockchain soared during the pandemic as developer...
- 1
- 2
