ETH Price
Bitcoin plumbs April lows as US dollar strength hits highest since May 2020
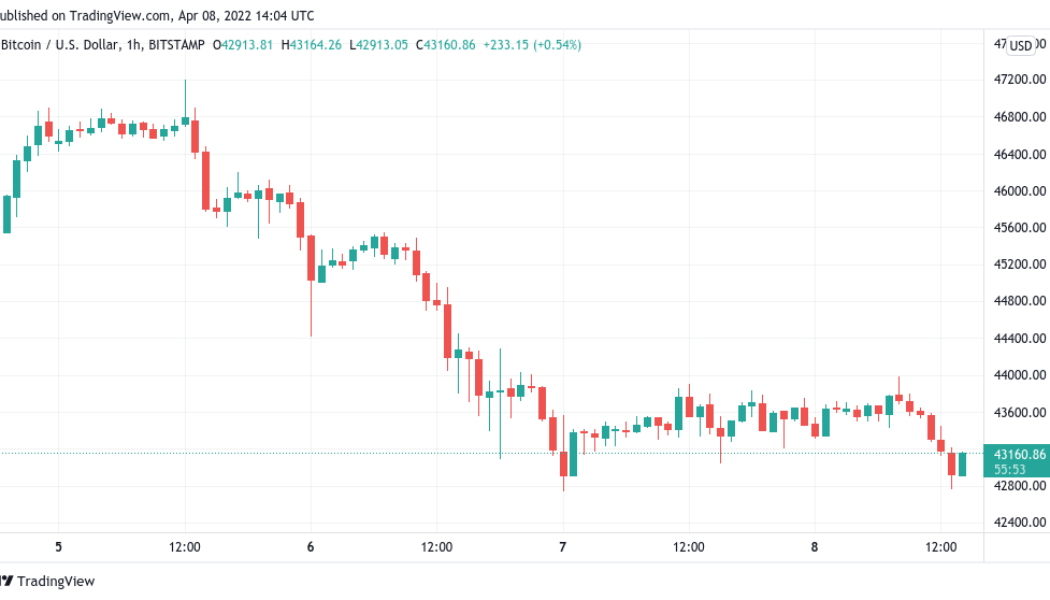
Bitcoin (BTC) neared new price lows for April on April 8’s Wall Street open amid a fresh surge in the U.S. dollar. BTC/USD 1-hour candle chart (Bitstamp). Source: TradingView $43,000 hangs in the balance Data from Cointelegraph Markets Pro and TradingView captured another day of gloom for BTC bulls as the largest cryptocurrency slipped back under $43,000. In a classic move, BTC/USD reacted unfavorably to a resurgent dollar, with the U.S. dollar currency index (DXY) returning above 100 for the first time since May 2020. Coming on the back of tightening measures from the Federal Reserve, the greenback also spelled a headache for stocks, which opened down on the day. U.S. dollar currency index (DXY) 1-week candle chart. Source: TradingView While some considered the DXY event a temp...
Bitcoin spikes to $41.7K highs as Ethereum nears $3K reclaim
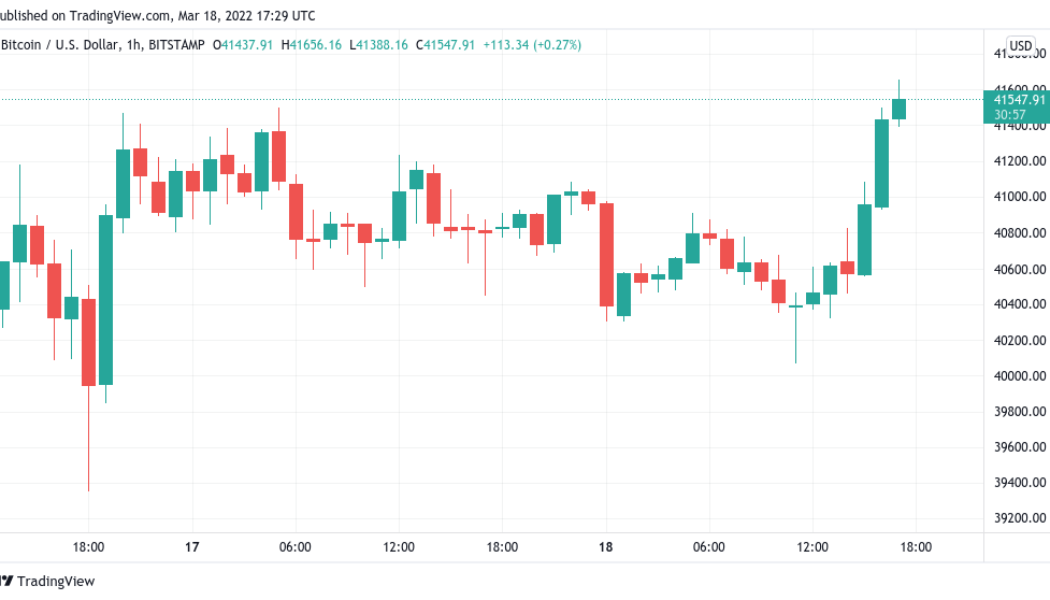
Bitcoin (BTC) saw brisk upwards action during the Wall Street trading session on March 18, conforming to predictions that higher levels would see a retest. BTC/USD 1-hour candle chart (Bitstamp). Source: TradingView Bets placed on $46,000 Data from Cointelegraph Markets Pro and TradingView followed BTC/USD as it advanced $1,650 from daily lows to nearly matching the $41,700 high from March 16. The move buoyed traders, who began to reinforce their short-term view of levels near the top of Bitcoin’s 2022 trading range being challenged. For popular trader Pentoshi, however, such a result would not mean that BTC/USD had broken its downtrend definitively. “Macro headwinds still too strong but midterm, I think we rally bc seller exhaustion before any shot at new lows or prev low...
Bitcoin loses $40K as BTC price support levels give way to 1-week lows
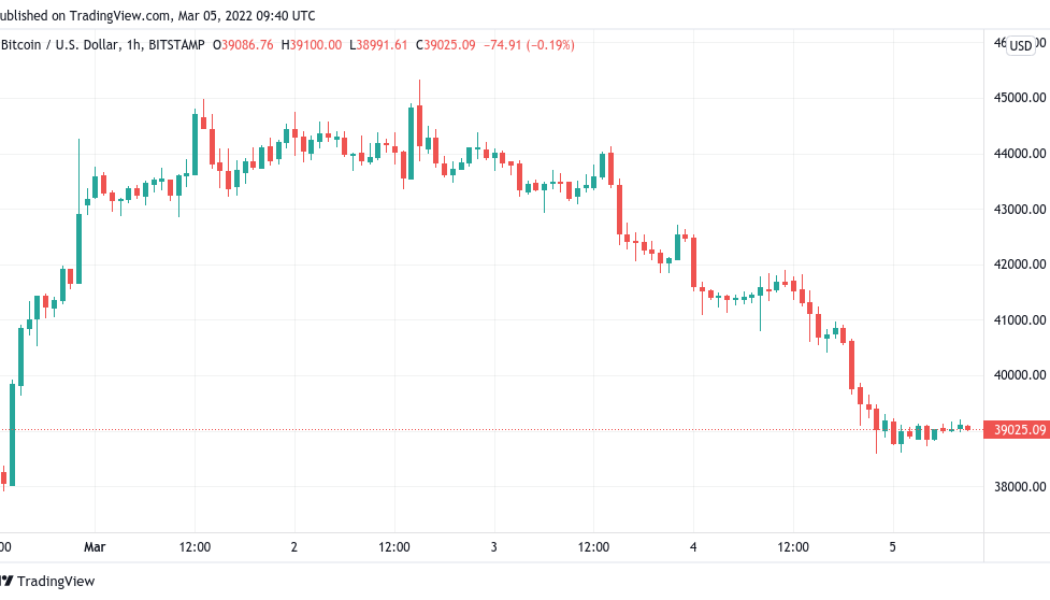
Bitcoin (BTC) stayed below some critical support zones into the weekend after a late sell-off cost bulls the $40,000 mark. BTC/USD 1-hour candle chart (Bitstamp). Source: TradingView Upper range support levels crumble for BTC Data from Cointelegraph Markets Pro and TradingView painted a lackluster picture for BTC/USD Saturday, the pair lingering near $39,000 after seeing lows of $38,600. Traders had hoped that various price points above $40,000 would be sufficient to steady the market after its latest run to $45,200. In the event, however, bids failed to preserve the trend, sending Bitcoin back to the middle of a range in which it had acted throughout 2022. #Bitcoin is hanging onto the edge of a cliff the past few hours pic.twitter.com/dAD2AveTOi — Matthew Hyland (@MatthewHyland_) Mar...
$300M in crypto liquidations accompanies Bitcoin’s surge to $44K
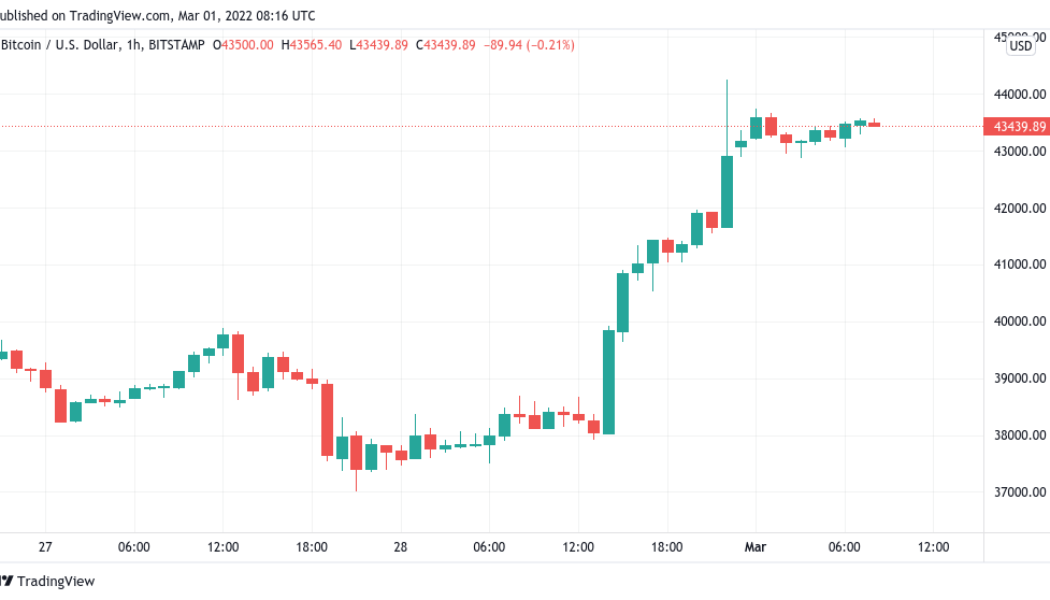
Bitcoin (BTC) hit $44,000 overnight on Mar. 1 as a rally that began Monday sparked unexpected results. BTC/USD 1-hour candle chart (Bitstamp). Source: TradingView Traders warns of “massive variables” for BTC price Data from Cointelegraph Markets Pro and TradingView showed BTC/USD reaching $44,250 on Bitstamp before consolidating, still above $43,000 at the time of writing. The move had come in two main bursts, beginning just prior to the Wall Street open. Against a highly uncertain macro backdrop, analysts had been hard-pressed to forecast what Bitcoin price action would do next, a mood that continued as local highs appeared. Yesterdays #BTC trade we took with the group. Didn’t expect it to run that hard tbh. Would have raised TP probably because I think it can...
Bitcoin hits $44K after Canada emergency powers accompany 6% BTC price increase
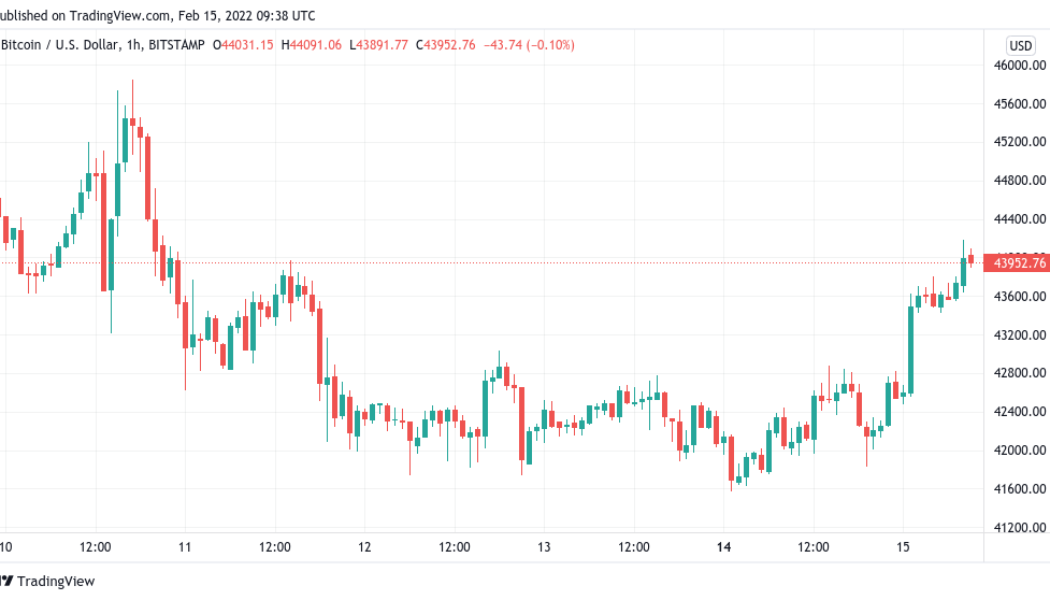
Bitcoin (BTC) opted for fresh upside on Feb. 15 as a trip to near $40,000 saw an abrupt change of direction. BTC/USD 1-hour candle chart (Bitstamp). Source: TradingView RSI prints classic bull signal Data from Cointelegraph Markets Pro and TradingView showed BTC/USD gaining swiftly overnight into Tuesday, going on to pass $44,000. A classic relative strength index (RSI) breakout, this time on the lower four-hour timeframe, preceded the move, which put the pair a full 6% higher versus Monday’s lows. #Bitcoin 4 Hour RSI broke out and MACD just had a Bullish Cross: pic.twitter.com/2bRVFeQsfX — Matthew Hyland (@MatthewHyland_) February 14, 2022 “I do think these are the first signs of a trend break,” popular Twitter account Phoenix commented in a fresh post on the day. It ...
Ethereum eyes $3.5K as ETH price reclaims pandemic-era support with 40% rebound
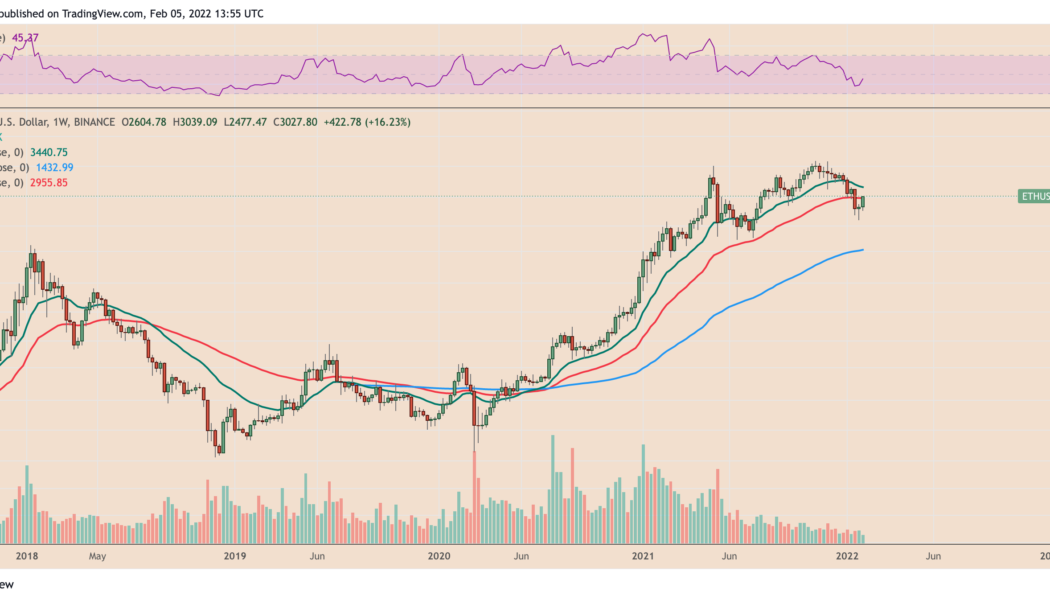
Ethereum’s native token Ether (ETH) looks poised to hit $3,500 in the coming sessions as it reclaimed a historically strong support level on Feb. 5. Ethereum price back above key trendline ETH price rising above its 50-week exponential moving average (50-week EMA; the red wave in the chart below) means the price also inched above $3,000, a psychological support level that may serve as the ground for Ether’s next leg up. ETH/USD weekly price chart. Source: TradingView The 50-week EMA was instrumental in maintaining Ether’s bullish bias across 2020 and 2021. For instance, it served as a strong accumulation zone during the market correction in the second and third quarters last year, pushing ETH price from around $1,700 to as high as $4,951 (data from Binance). As a result, ...
Bearish chart pattern hints at $70 Solana (SOL) price before a possible oversold bounce
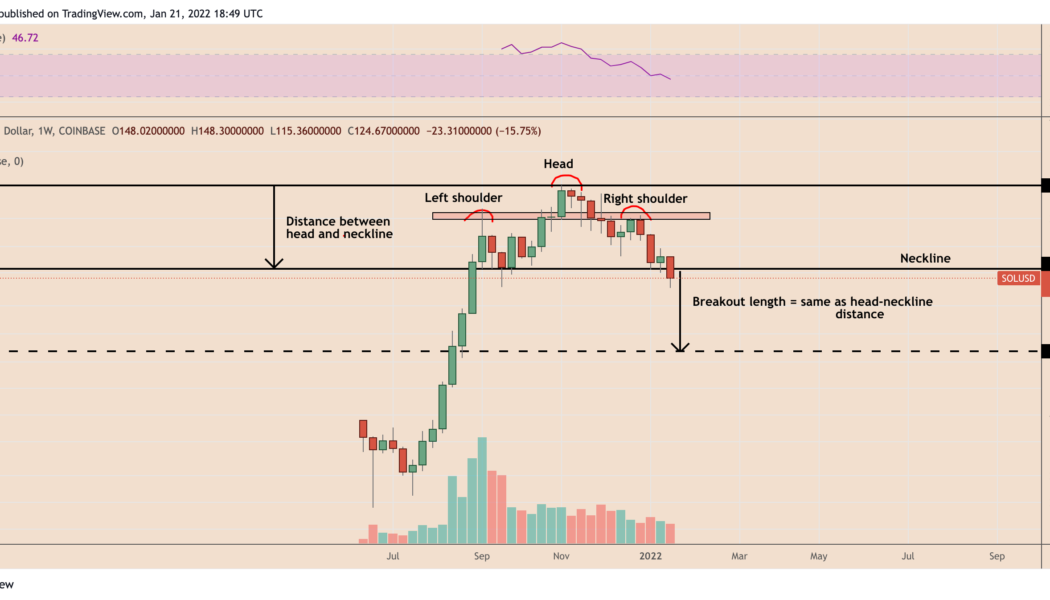
Solana (SOL) price may fall to $70 a token in the coming weeks as a head and shoulders setup emerged on the daily timeframe and possibly points toward a 45%+ decline. The chart below shows that SOL price rallied to nearly $217 in September 2021, dropped to a support level near $134 and then moved to establish a new record high of $260 in November 2021. Earlier this week, the price fell back to test the same $134-support level before breaking to a 2022 low at $87.73. SOL/USD weekly price chart featuring head and shoulders setup. Source: TradingView This phase of price action appears to have formed a head and shoulders setup, a bearish reversal pattern containing three consecutive peaks, with the middle one around $257 (called the “head”) coming out to be higher than the oth...
Bitcoin slips under $50K amid warning ‘new player’ Binance whale is pressuring BTC price
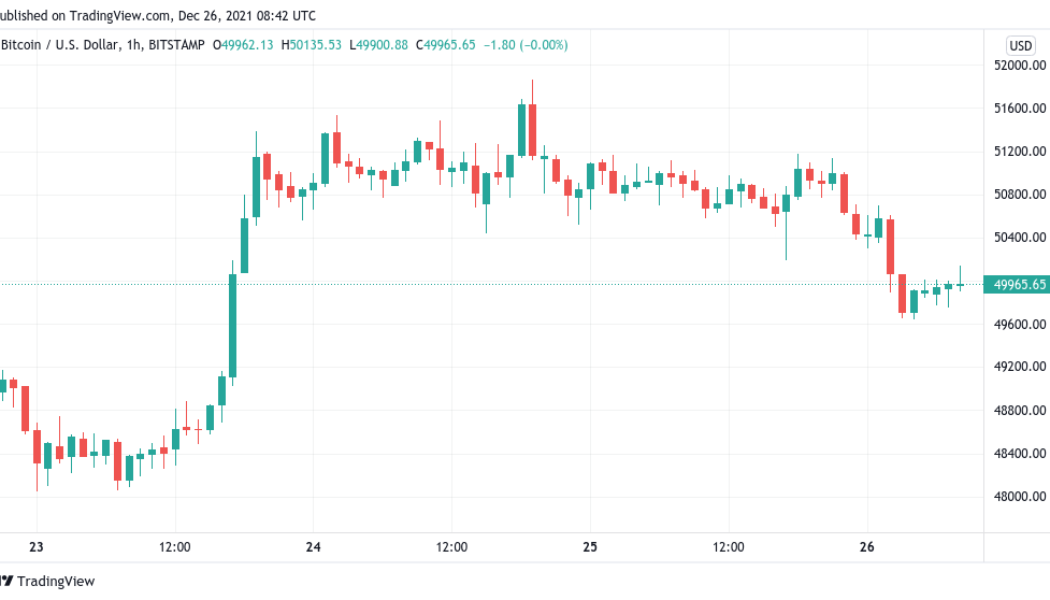
Bitcoin (BTC) lost $50,000 for the first time in several days on Dec. 26 as exchange inflows caught up with the cautiously optimistic mood. BTC/USD 1-hour candle chart (Bitstamp). Source: TradingView “New player” beefs up $50,000 sell wall Data from Cointelegraph Markets Pro and TradingView showed volatility hitting BTC/USD overnight on Saturday. The pair had reached $51,500 before starting to retrace, this culminating in a dip to $49,644. At the time of writing, Bitcoin was back circling $50,000. The move came in tandem with a rise in inflows to major exchange Binance, with order book data showing a new wall of resistance being built at $50,000. Binance order book heatmap chart. Source: Material Indicators The behavior points to a large-volume investor shaping market bias...
Bitcoin price flatlines as XRP hits $1 with ‘massive’ altcoin move set for 2022
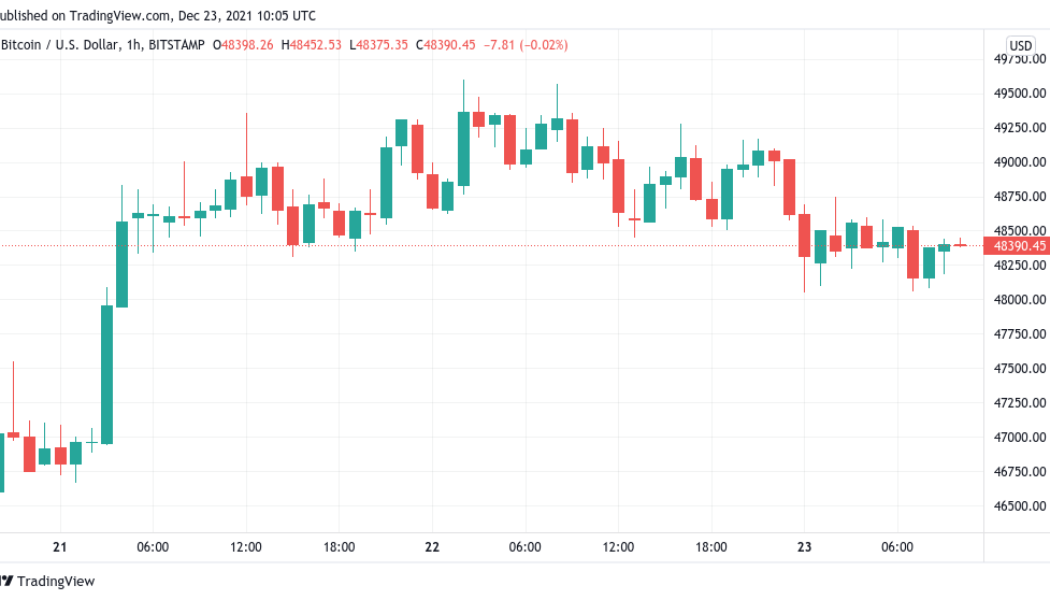
Bitcoin (BTC) stuck rigidly to its tight range on Dec. 23 as price action continued to contradict strong buying activity. BTC/USD 1-hour candle chart (Bitstamp). Source: TradingView Hodlers busy accumulating Data from Cointelegraph Markets Pro and TradingView showed BTC/USD failing to hold $49,000 after hitting 10-day highs. The pair remained stuck in a trading zone only around $4,000 wide, a key factor fuelling bets that a “short squeeze” would hit over the holiday period. Against declining volatility, data reinforced conviction among investors, with the supply being bought up at roughly three times the rate of new BTC being mined. “Strong handed HODLers are absorbing supply at more than triple the rate of new coins being mined each day,” on-chain analytics firm Glassnode summarized ...
Small Ethereum investors increase exposure as ETH loses $4K level
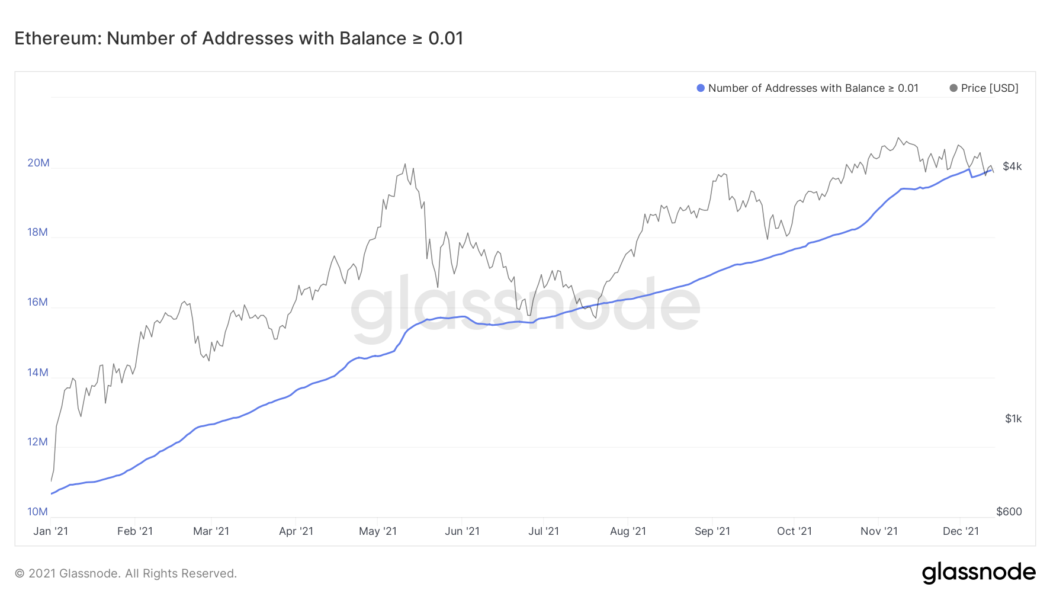
Ethereum’s native token Ether (ETH) has dropped by over 18% after establishing an all-time high around $4,867 on Nov. 10, now trading near $3,900. Nonetheless, the plunge has not deterred retail investors from buying the token in small quantities. According to data gathered by Glassnode — a blockchain analytics platform, the number of Ether addresses holding less than or equal to 0.01 ETH reached a record high level of 19.95 million on Dec. 4, the day ETH dropped to as low as $3,575 (data from Coinbase). Ethereum addresses with balances less than or equal to 0.01. Source: Glassnode Meanwhile, the number of Ethereum wallets with balances of at least 0.1 ETH also kept climbing despite Ether’s correction from $4,867 to $3,575, eventually hitting a new all-time high of 6.37 million...
3 reasons why Ethereum price can drop below $3K by the end of 2021
Ethereum’s native token Ether (ETH) reached an all-time high around $4,867 earlier in November, only to plunge by nearly 20% a month later on rising profit-taking sentiment. And now, as the ETH price holds $4,000 as a key support level, risks of further selloffs are emerging in the form of multiple technical and fundamental indicators. ETH price rising wedge First, Ether appears to have been breaking out of “rising wedge,” a bearish reversal pattern that emerges when the price trends upward inside a range defined by two ascending — but converging — trendlines. Simply put, as the Ether price nears the Wedge’s apex point, it risks breaking below the pattern’s lower trendline, a move that many technical chartists see as a cue for more losses ahead. In doing so, t...
