ETH Price
How low can Ethereum price drop versus Bitcoin amid the DeFi contagion?
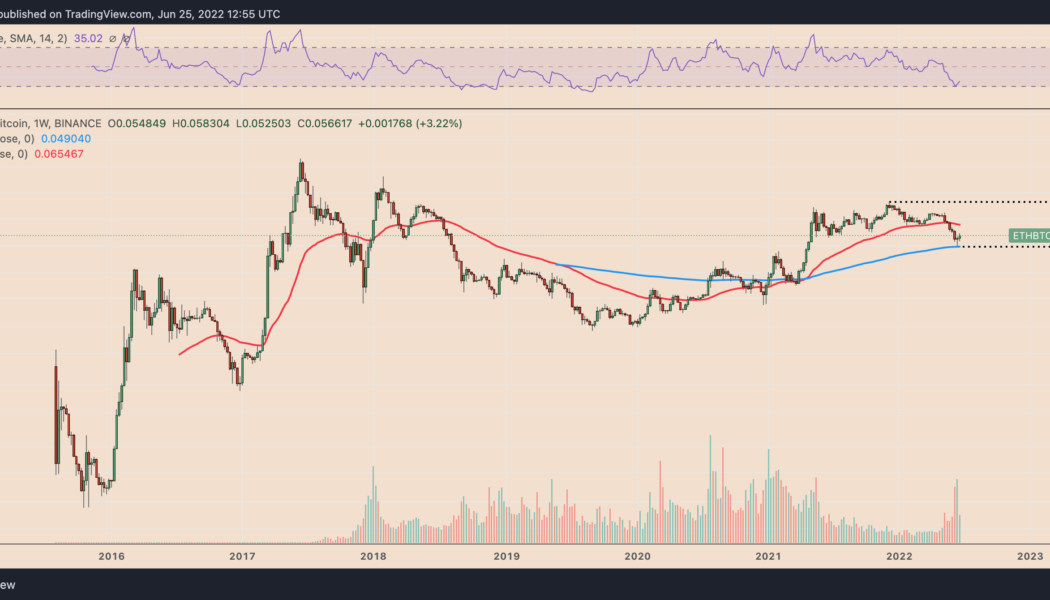
Ethereum’s native token Ether (ETH) has declined by more than 35% against Bitcoin (BTC) since December 2021 with a potential to decline further in the coming months. ETH/BTC weekly price chart. Source: TradingView ETH/BTC dynamics The ETH/BTC pair’s bullish trends typically suggest an increasing risk appetite among crypto traders, where speculation is more focused on Ether’s future valuations versus keeping their capital long-term in BTC. Conversely, a bearish ETH/BTC cycle is typically accompanied by a plunge in altcoins and Ethereum’s decline in market share. As a result, traders seek safety in BTC, showcasing their risk-off sentiment within the crypto industry. Ethereum TVL wipe-out Interest in the Ethereum blockchain soared during the pandemic as developer...
Ethereum price breaks out as ‘bad news is good news’ for stocks
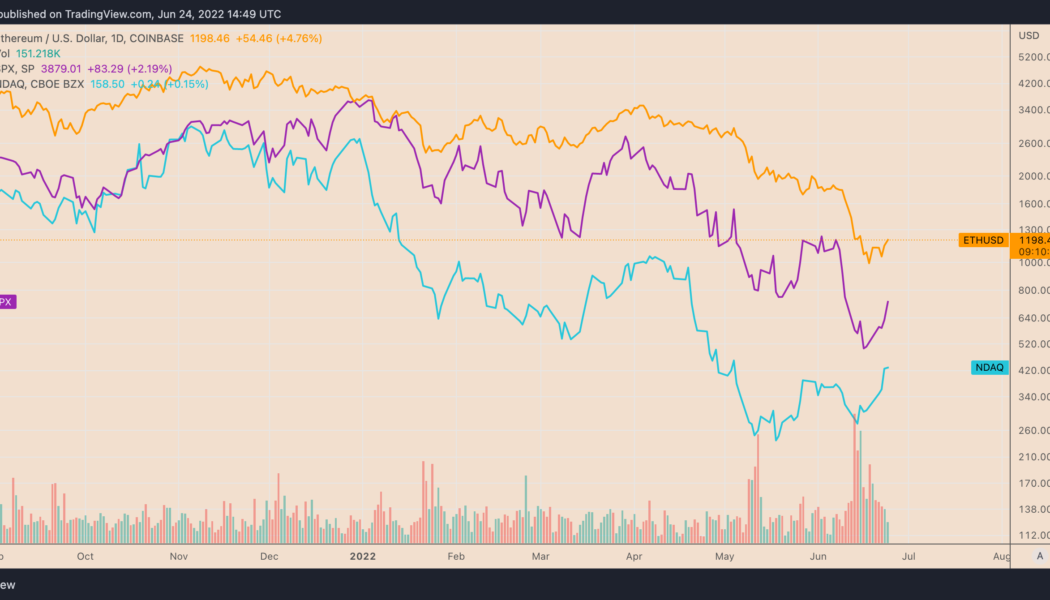
Ethereum’s native token, Ether (ETH), gained alongside riskier assets as investors assessed weak U.S. economic data and its potential to cool down rate hike fears. Ether mirrors risk-on recovery ETH’s price climbed up to 8.31% on June 24 to $1,225, six days after falling below $880, its lowest level since January 2021. Overall, the upside retracement brought bulls 40% in gains, raising anticipation about an extended recovery in the future while alleviating fears of a “clean fakeout.” For instance, independent market analyst “PostyXBT” projected ETH’s price to close above $1,300 by the end of June. In contrast, analyst “Wolf” feared that bears would attempt to “push price back to $1,047,” albeit anticipating a run-up to...
Ethereum risks another 60% drop after breaking below $1K to 18-month lows
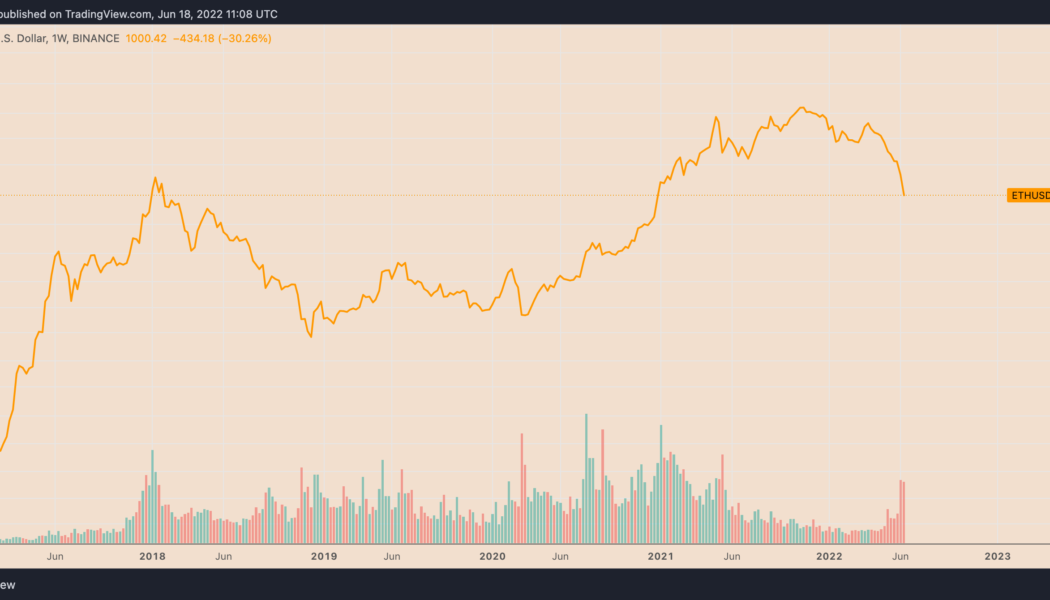
The price of Ethereum’s native token, Ether (ETH), careened below $1,000 on June 18 as the ongoing sell-off in the crypto market continued despite the weekend. Ether reached $975, its lowest level since January 2021, losing 80% of its value from its record high in November 2021. The decline appeared amid concerns about the Federal Reserve’s 75 basis points rate hike, a move that pushed both cryptocurrencies and stocks into a strong bear market. “The Federal Reserve has barely started raising rates, and for the record, they haven’t sold anything on their balance sheet either,” noted Nick, an analyst at data resource Ecoinometrics, warnings that “there is bound to be more downside coming.” ETH/USD weekly price chart. Source: TradingView Ethereum...
Ethereum crashed by 94% in 2018 — Will history repeat with ETH price bottoming at $375?
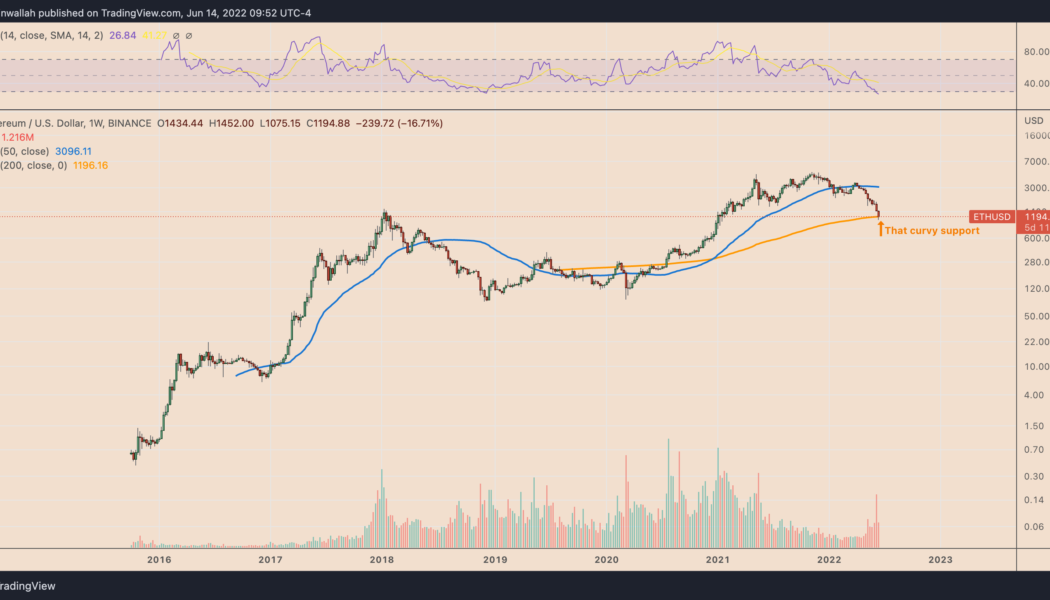
Ethereum’s native token Ether (ETH) is showing signs of bottoming out as ETH price bounced off a key support zone. Notably, ETH price is now holding above the key support level of the 200-week simple moving average (SMA) near $1,196. The 200-week SMA support seems purely psychological, partly due to its ability to serve as bottom levels in the previous Bitcoin bear markets. Independent market analyst “Bluntz” argues that the curvy level would also serve as a strong price floor for Ether where accumulation is likely. He notes: “BTC has bottomed 4x at the 200wma dating back to 2014. [Probably] safe to assume it’s a pretty strong level. Sure we can wick below it, but there [are] also six days left in the week.” ETH/USD weekly pric...
BTC price crashes to $20.8K as ‘deadly’ candles liquidate $1.2 billion
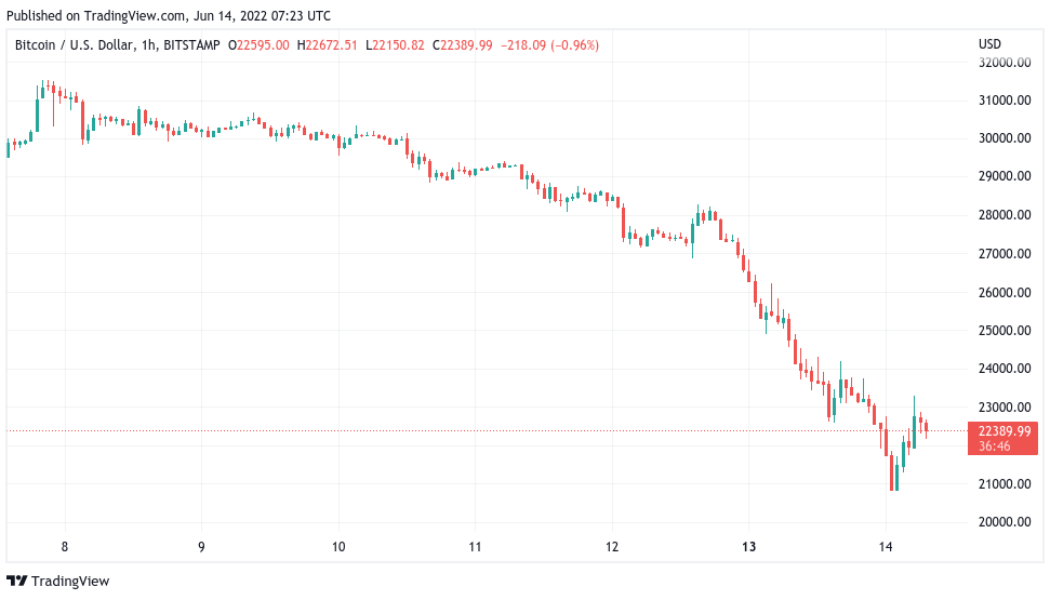
Bitcoin (BTC) came within $1,000 of its previous cycle all-time highs on June 14 as liquidations mounted across crypto markets. BTC/USD 1-hour candle chart (Bitstamp). Source: TradingView Bitcoin price hits 18-month lows Data from Cointelegraph Markets Pro and TradingView showed BTC/USD hitting $20,816, on Bitstamp, its lowest since the week of December 14, 2020. A sell-off that began before the weekend intensified after the June 13 Wall Street opening bell, with Bitcoin and altcoins falling in step with United States equities. The S&P 500 finished the day down 3.9%, while the Nasdaq Composite Index shed 4.7% ahead of key comments from the U.S. Federal Reserve on its anti-inflation policy. The worst of the rout was reserved for crypto, however, and with that, BTC/USD lost 22...
Ethereum price enters ‘oversold’ zone for the first time since November 2018
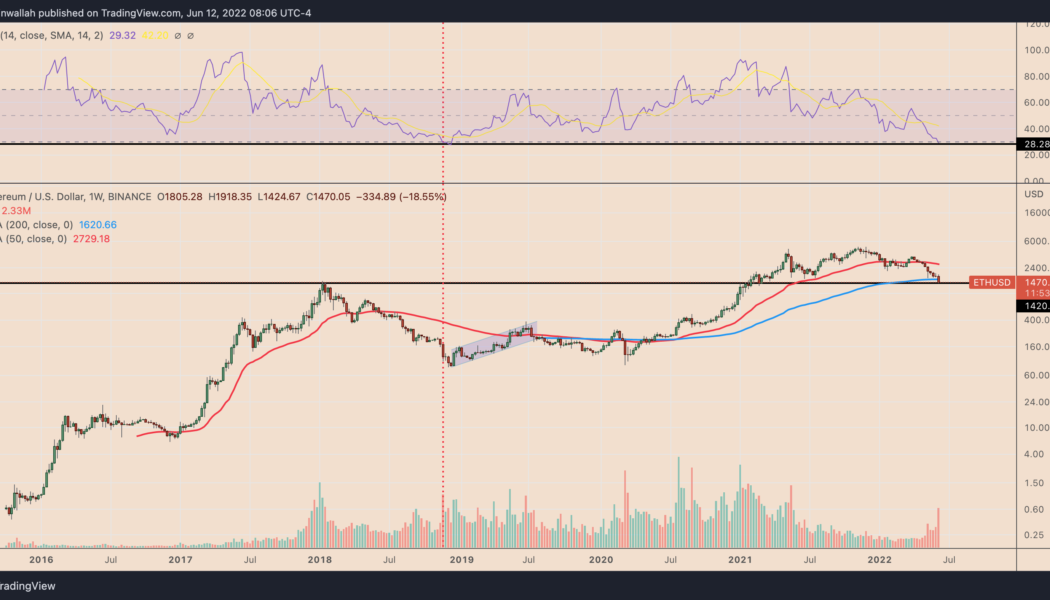
Ethereum’s native token Ether (ETH) entered its “oversold” territory this June 12, for the first time since November 2018, according to its weekly relative strength index (RSI). This is the last time $ETH went oversold on the weekly (hasn’t confirmed here yet). I had no followers, but macro bottom ticked it. Note, you can push way lower on weekly rsi, not trying to catch a bottom. https://t.co/kLCynTKTcS — The Wolf Of All Streets (@scottmelker) June 12, 2022 ETH eyes oversold bounce Traditional analysts consider an asset to be excessively sold after its RSI reading fall below 30. Furthermore, they also see the drop as an opportunity to “buy the dip,” believing an oversold signal would lead to a trend reversal. Ether’s previous oversold reading appeared i...
Ethereum eyes fresh yearly lows vs. Bitcoin as bulls snub successful ‘Merge’ rehearsal
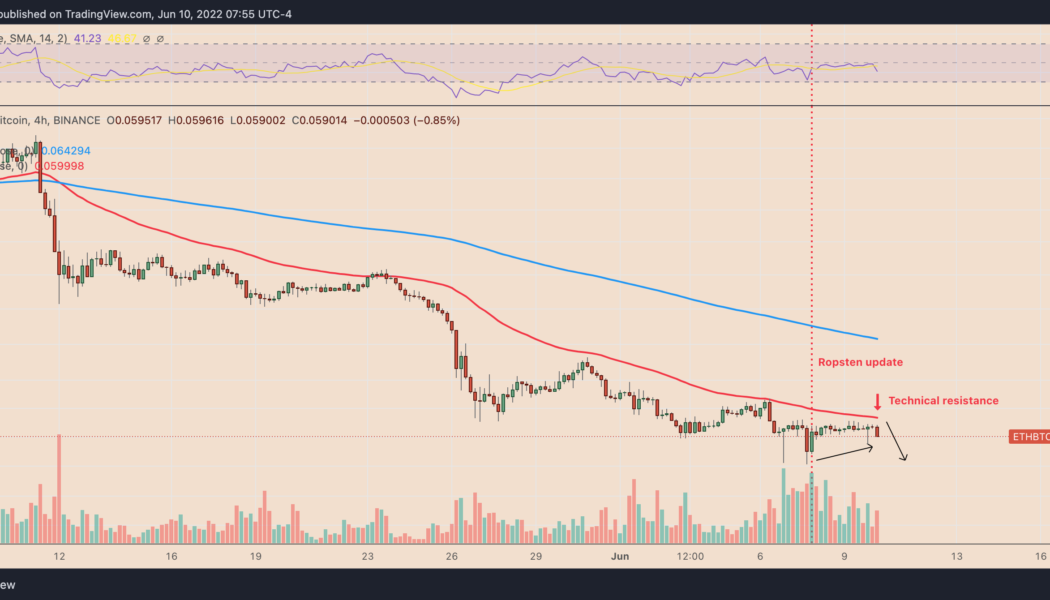
Ethereum’s native token Ether (ETH) resumed its decline against Bitcoin (BTC) two days after a successful rehearsal of its proof-of-stake (PoS) algorithm on its longest-running testnet “Ropsten.” The ETH/BTC fell by 2.5% to 0.0586 on June 10. The pair’s downside move came as a part of a correction that had started a day before when it reached a local peak of 0.0598, hinting at weaker bullish sentiment despite the optimistic “Merge” update. ETH/BTC four-hour price chart. Source: TradingView Interestingly, the selloff occurred near ETH/BTC’s 50-4H exponential moving average (50-4H EMA; the red wave) around 0.06. This technical resistance has been capping the pair’s bullish attempts since May 12, as shown in the chart above. Staked Ether behind ...
Brandt’s bearish ETH call — But community predicts $3K before Merge
Veteran futures trader Peter Brandt has suggested that the price of Ether (ETH) could drop to as low as $1,268 in the coming month, but the consensus view of 15,500 members of the CoinMarketCap community is that the price will have hit roughly $3,131 by June 30. The Ethereum network is now in the final steps of its long-awaited Merge with the Beacon Chain and transition to proof-of-stake (PoS), with developers confirming on Wednesday that they successfully completed the Ropsten testnet merge. The Ropsten testnet has now been merged! What a historic and thrilling day for the Ethereum community and what a thrilling day for Next up, 2 more public testnet merges and then mainnet The Merge is coming — sassal.eth (@sassal0x) June 8, 2022 While the timeframe has often been subject to delays, the ...
BNB price risks 40% drop as SEC launches probe against Binance
Binance Coin (BNB) price dropped by nearly 7.3% on June 7 to below $275, its lowest level in three weeks. What’s more, BNB price could drop by another 25%–40% in 2022 as its parent firm, Binance, faces allegations of breaking securities rules and laundering billions of dollars in illicit funds for criminals. Bad news twice in a row BNB was issued as a part of an initial coin offering (ICO) in 2017 that amassed $15 million for Binance. The token mainly behaves as a utility asset within the Binance ecosystem, primarily enabling traders to earn discounts on their trading activities. Simultaneously, BNB also functions as a speculative financial asset, which has made it the fifth-largest cryptocurrency by market capitalization. BNB market capitalization was $45.42 billion as of June ...
3 reasons Ethereum price risks 25% downside in June
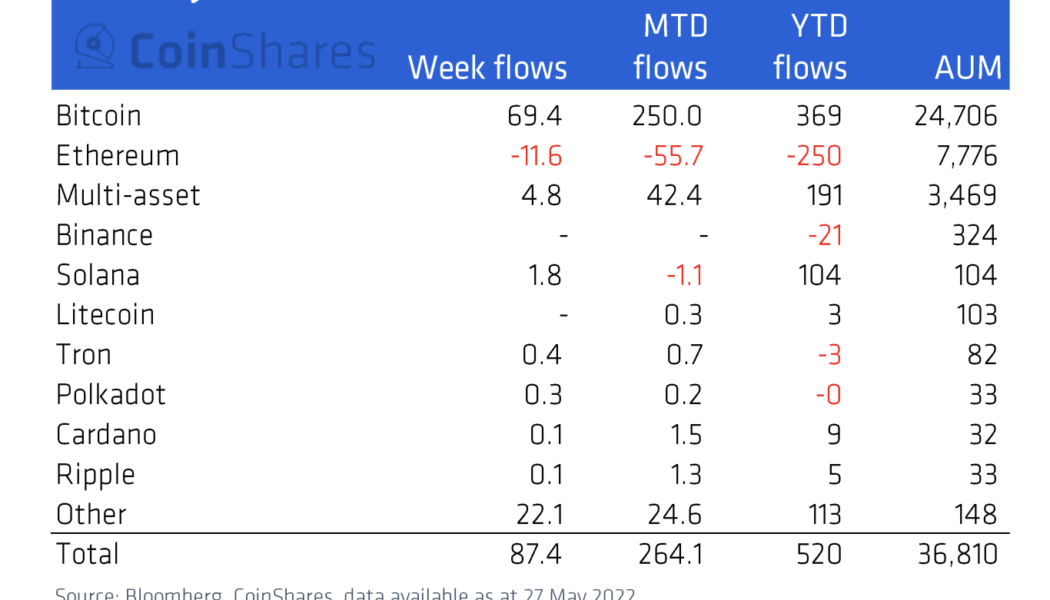
Ethereum’s native token Ether (ETH) has dropped more than half of its value in 2022 in dollar terms, while also losing value against Bitcoin (BTC) and now remains pinned below $2,000 for several reasons. What’s more, ETH price could face even bigger losses in June due to another slew of factors, which will be discussed below. Ethereum funds lose capital en masse Investors have withdrawn $250 million out of Ethereum-based investment funds in 2022, according to CoinShares’ weekly market report published May 31. The massive outflow appears in contrast to other coins. For instance, investors have poured $369 million into Bitcoin-based investment funds in 2022. Meanwhile, Solana and Cardano, layer-one blockchain protocols competing with Ethereum, have attracted $104 million and ...
Bitcoin price returns to weekly lows under $29K as Nasdaq leads fresh US stocks dive
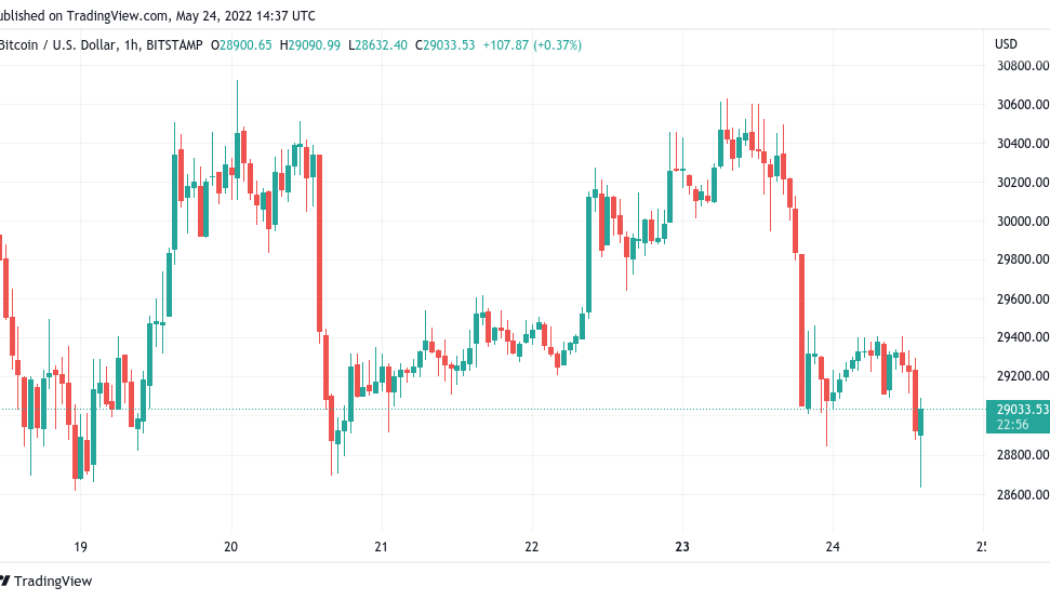
Bitcoin (BTC) fell on the May 24 Wall Street open as weakness in stocks saw sell-side pressure return. BTC/USD 1-hour candle chart (Bitstamp). Source: TradingView Equities give crypto no respite Data from Cointelegraph Markets Pro and TradingView followed BTC/USD as it revisited its lowest levels of the past seven days. At the time of writing, BTC/USD traded at around $28,800 amid volatility, having hit $28,614 on Bitstamp — a zone last seen on May 18. The S&P 500 lost 2.4% on the open, while the Nasdaq 100 managed a 3.5% decline. Stocks once again controlling the price of #Bitcoin. What’s surprising is how well it’s holding up relatively though. Most stocks having way larger daily drops than $BTC. — IncomeSharks (@IncomeSharks) May 24, 2022 In a fresh Twitter update, ...
