ETH Price
Ethereum ‘shark’ accumulation, Shanghai hard fork put $2K ETH price in play
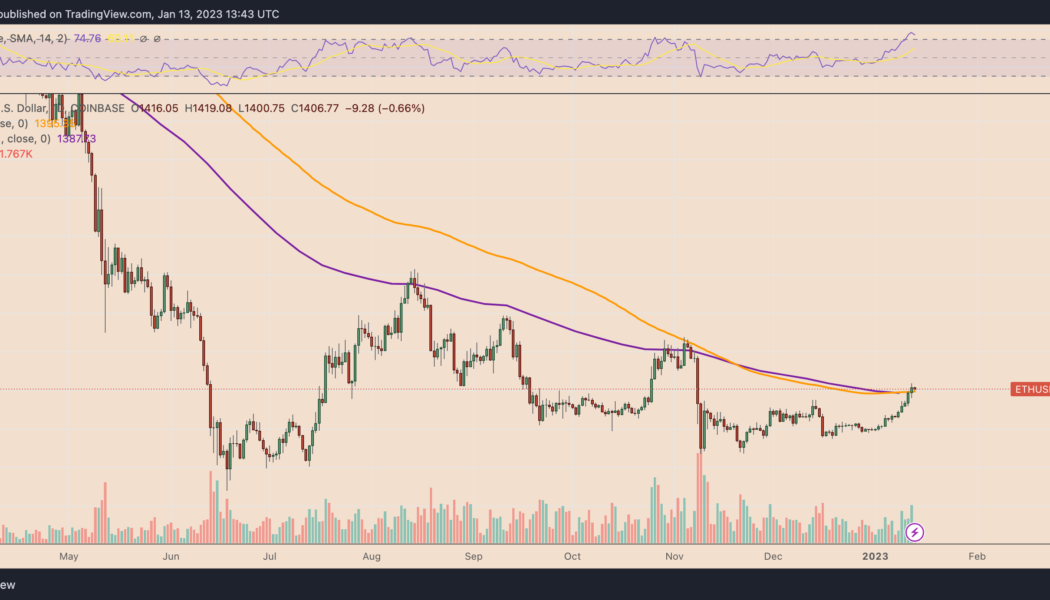
Ether (ETH) price technicals suggest that 35% gains are in play by March 2022 due to several bullish technical and fundamental factors. Ether price rises above two key moving averages On Jan. 8, Ether’s price crossed above its 21-week exponential moving average (21-week EMA; the purple wave) and 200-day simple moving average (200-day SMA; the orange wave). Historically, these two moving averages have separated bull and bear markets. When ETH’s price trades above them, it is considered to be in a bull market, and vice versa. ETH/USD daily price chart featuring 21-week EMA and 200-day SMA. Source: TradingView The last time Ether crossed above its 21-week EMA and 200-day SMA was in April 2022. But this was a fakeout, in part due to the collapse of Terra (LUNA) the following month. B...
Ethereum sets record ETH short liquidations, wiping out $500 billion in 2 days
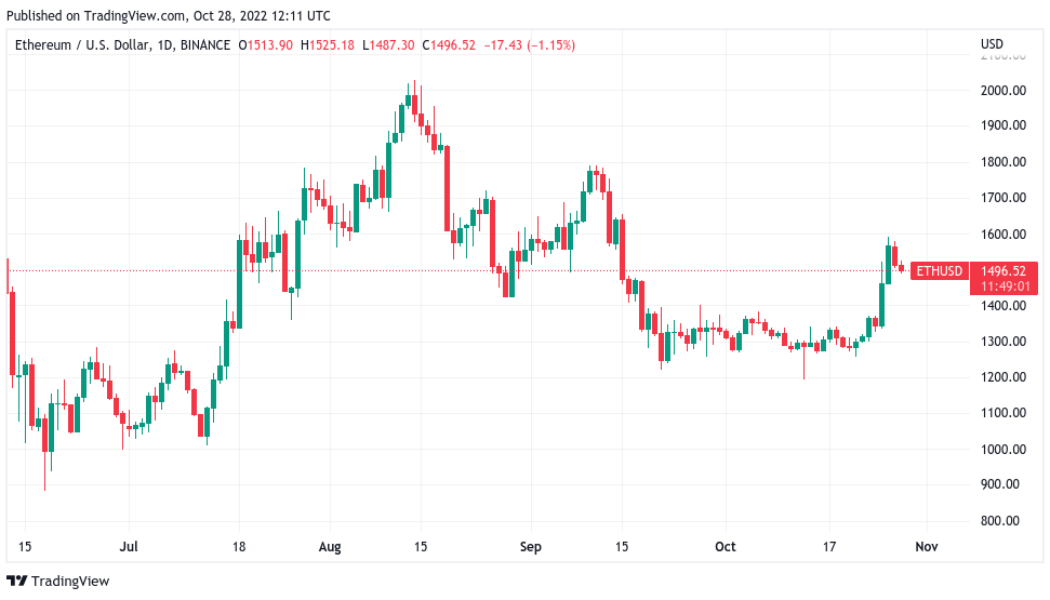
Ether (ETH) is setting liquidation records this week as a comparatively modest price uptick reveals how bearish the market has become. Data from on-chain analytics platform CryptoQuant confirmed that United States dollar-denominated short liquidations hit a new all-time high on Oct. 25. Two days, half a billion dollars of ETH shorts It is not just Bitcoin (BTC) causing the bears severe pain this week — data from exchanges also shows that Ethereum shorters have suffered heavy losses. ETH/USD delivered fairly impressive gains on Oct. 25-26, rising from lows of $1,337 to highs of $1,593 on Bitstamp before retracing, according to data from Cointelegraph Markets Pro and TradingView. ETH/USD 1-day candle chart (Bitstamp). Source: TradingView While nothing unusual for crypto and for altcoins, in ...
Bitcoin price loses $20K, ETH price drops 8% after ‘monumental’ Ethereum Merge
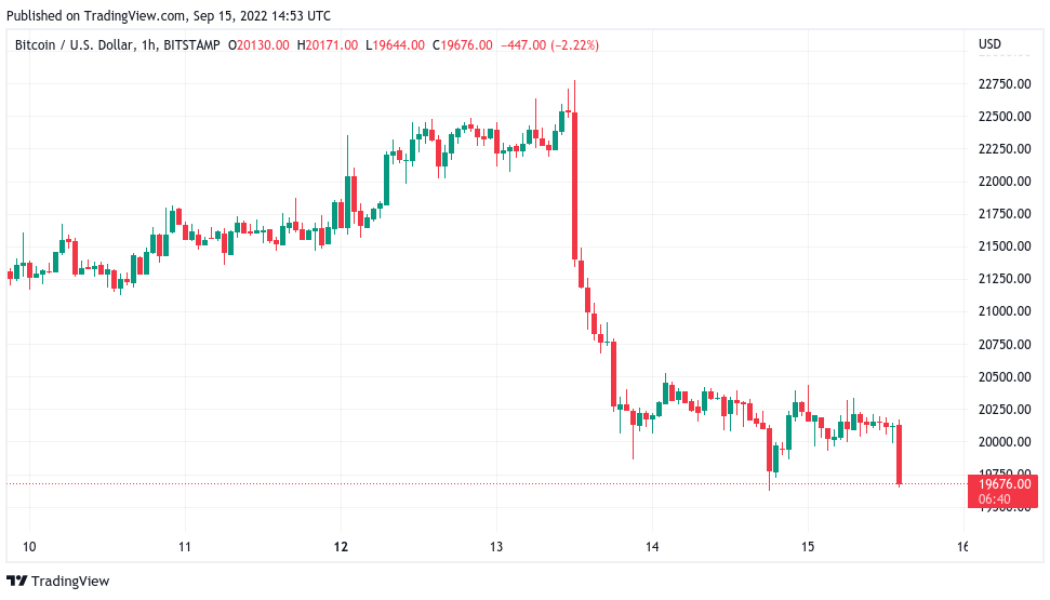
Bitcoin (BTC) spent a second day threatening $20,000 support on Sept. 15 as markets processed the Ethereum (ET Merge. BTC/USD 1-hour candle chart (Bitstamp). Source: TradingView BTC stuck between price magnets’ Data from Cointelegraph Markets Pro and TradingView showed BTC/USD spiking below $20,000 again overnight to recover marginally above the boundary for a brief period. The largest cryptocurrency broadly failed to regain lost ground after surprise United States inflation data on Sep. 13 sent risk assets into a tailspin. Down 13.5% versus the week’s top at the time of writing, Bitcoin offered little inspiration to traders who were still eyeing further losses. Yes, we could pump from here. No, the bottom is not in. pic.twitter.com/dXYKngcQtR — Material Indicators (@MI_Algos) S...
Ethereum hits 8-month highs in BTC as money heads for ‘riskier’ altcoins
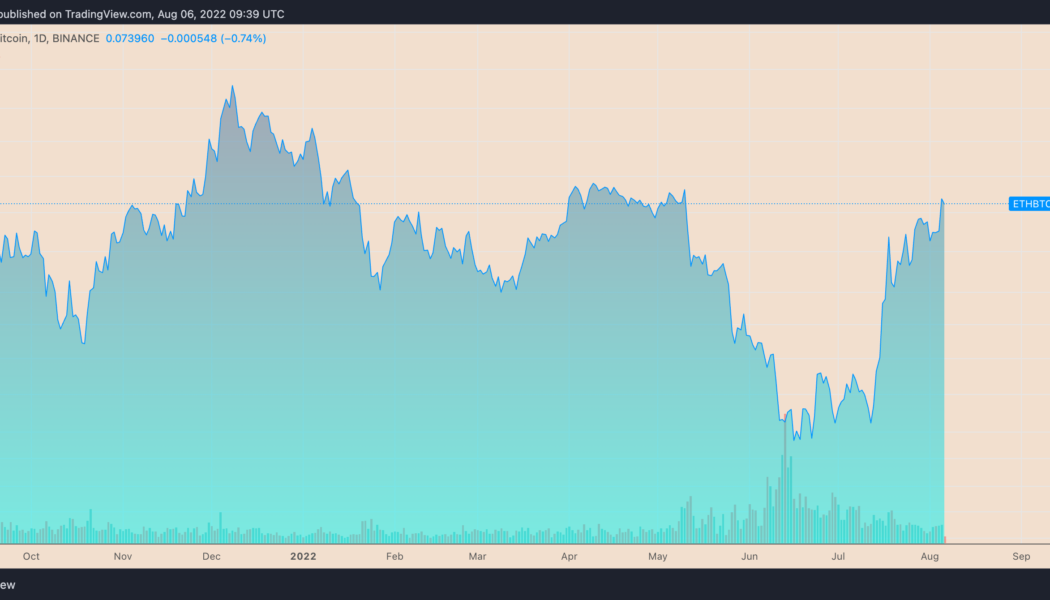
Ether (ETH) is worth more in Bitcoin (BTC) than at any time since the start of the year amid renewed appetite for altcoins. ETH/BTC 1-day candle chart (Binance). Source: TradingView Altcoin market cap returns to $700 billio Data from Cointelegraph Markets Pro and TradingView confirms that ETH/BTC has cleared key resistance to pass 0.08 BTC on Aug. 13. The move is impressive for largest altcoin Ethereum, as the area around 0.075 represented a troublesome sell zone which had previously kept bulls in check for since January. At the time of writing, ETH/BTC is working to retain the newly-won level, as traders query how long its strength might last. As Cointelegraph reported earlier, ETH/USD passed $2,000 overnight, a significant psychological boundary in itself unseen since May. Not for l...
Ethereum price rises by 50% against Bitcoin in one month — but there’s a catch
Ether (ETH), Ethereum’s native toke, has been continuing its uptrend against Bitcoin (BTC) as euphoria around its upcoming network upgrade, “the Merge,” grows. ETH at multi-month highs against BTC On the daily chart, ETH/BTC surged to an intraday high of 0.075 on Aug. 6, following a 1.5% upside move. Meanwhile, the pair’s gains came as a part of a broader rebound trend that started a month ago at 0.049, amounting to approximately 50% gains. ETH/BTC daily price chart. Source: TradingView The ETH/BTC recovery in part has surfaced due to the Merge, which will have Ethereum switch from proof-of-work (PoW) mining to proof-of-stake (PoS). Ethereum’s “rising wedge” suggests sell-off From a technical perspective, Ether stares at potential interim loss...
Ethereum futures backwardation hints at 30% ‘airdrop rally’ ahead of the Merge
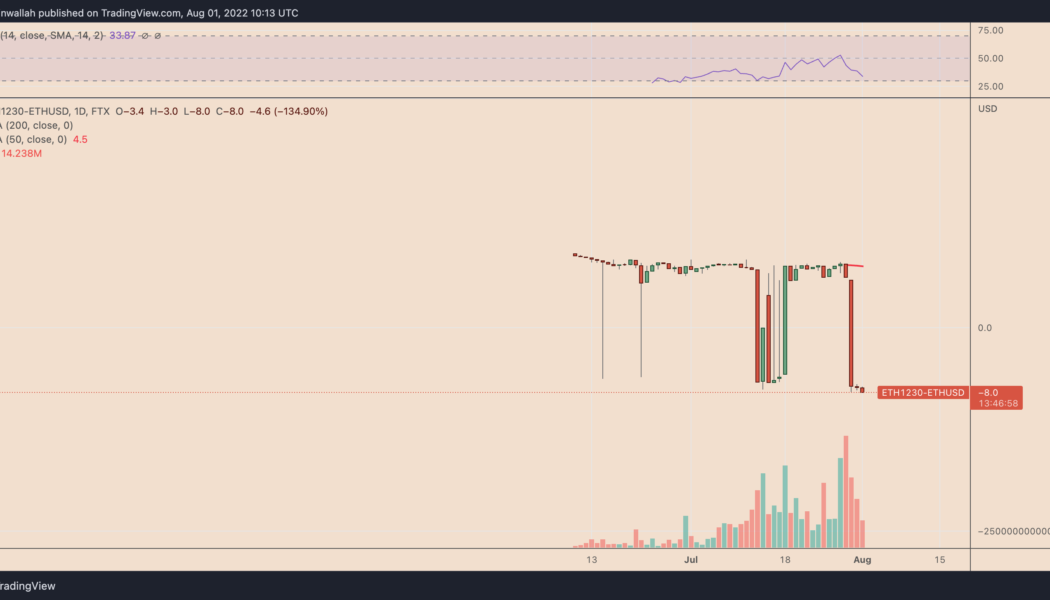
Ether (ETH) bulls like a positive spread between its spot and ETH futures prices because the so-called contango reflects optimism about a higher rate in the future. But as of Aug. 1, the Ethereum futures curve slid in the opposite direction. Ethereum quarterly futures in backwardation On the daily chart, Ethereum futures quarterly contracts, scheduled to expire in December 2022, have slipped into backwardation, a condition opposite to contango, wherein the futures price becomes lower than the spot price. The spread between Ethereum’s spot and futures price grew to -$8 on Aug. 1. ETH230-ETHUSD daily price chart. Source: TradingView One one hand, the current ETH spot price being higher than its year-end outlook appears like a bearish sign. However, the conditions surrou...
Ethereum’s bearish U-turn? ETH price momentum fades after $1.6K rejection
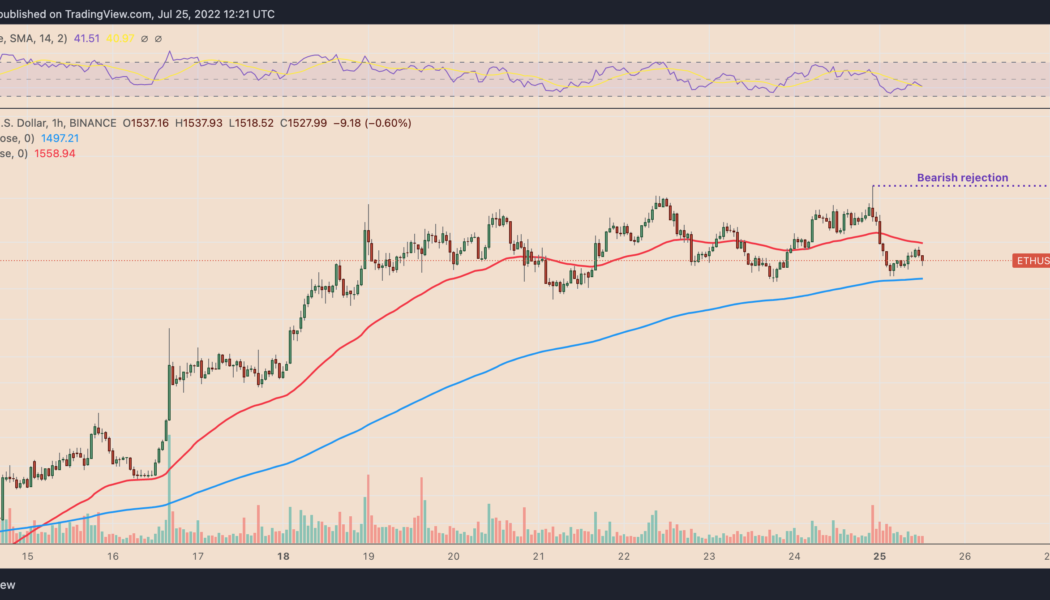
Ethereum’s native token Ether (ETH) tumbled on July 26, reducing hopes of an extended price recovery. The ETH/USD pair dropped by roughly 5%, followed by a modest rebound to over $1,550. Ethereum gets rejected at $1,650 These overnight moves liquidated over $80 million worth of Ether positions in the last 24 hours, data from CoinGlass reveals. ETH/USD hourly price chart. Source: TradingView The seesaw action also revealed an underlying bias conflict among traders who have been stuck between two extremely opposite market fundamentals. The first is the euphoria surrounding Ethereum’s potential transition to proof-of-stake in September, which has helped Ether’s price to recover 45% month-to-date. However, this bullish hype is at odds with macroeconomic headwinds, namel...
Ethereum Classic soars 100% in nine days outperforming ETH as ‘the Merge’ approaches
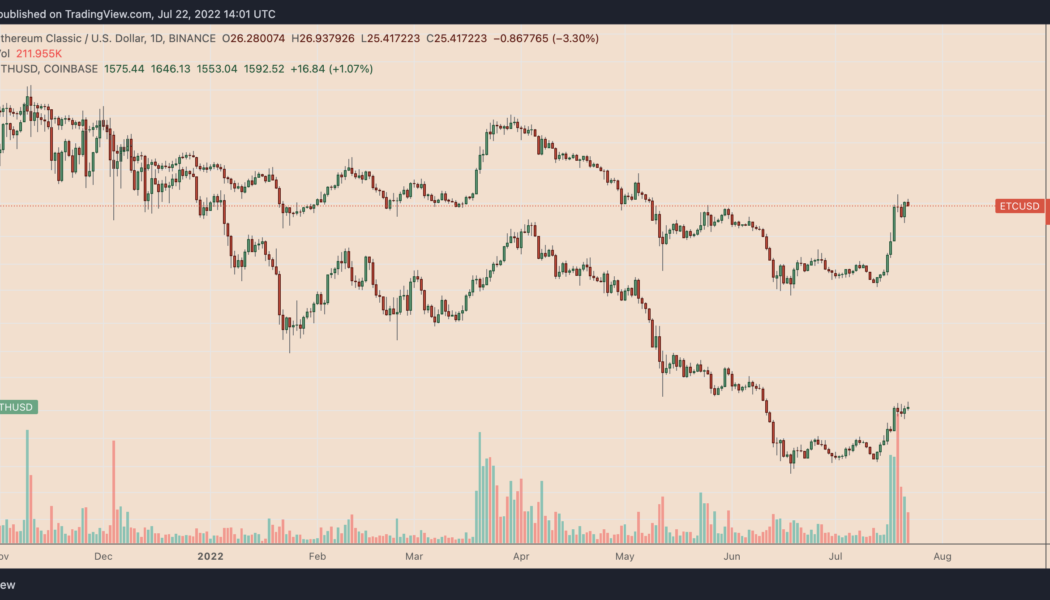
Ethereum Classic (ETC) has been outperforming its arch-rival Ethereum’s native token Ether (ETH) during the current crypto market rebound with the ETC/ETH pairs at 10-month highs. Why is ETC beating ETH? ETC’s price has risen to $27 on July 22, amounting to a 100% gain in nine days after bottoming out at $13.35. Comparatively, ETH’s price has seen a 64% rally in U.S. dollar terms. ETC/USD versus ETH/USD daily price chart. Source: TradingView Ethereum’s rebound has been among the sharpest among the top cryptocurrencies, primarily due to the euphoria surrounding its potential network upgrade in September. Dubbed “the Merge,” the long-awaited technical update will switch Ethereum from proof-of-work (PoW) to proof-of-stake (PoS). Anyone who believes the #Eth...
Ethereum traders gauge fakeout risks after 40% ETH price rally
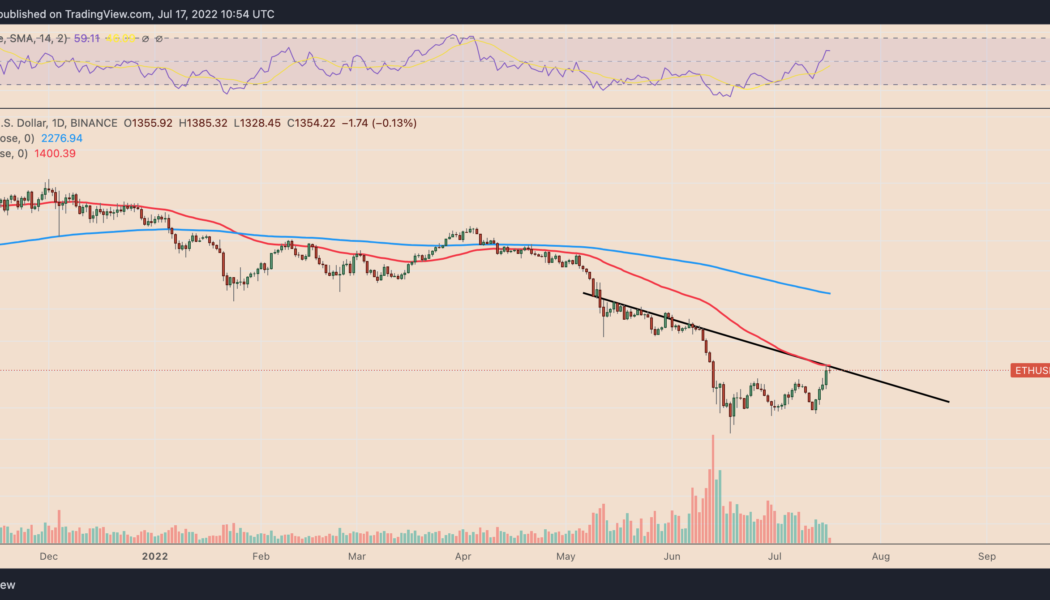
Ethereum’s native token Ether (ETH) saw a modest pullback on July 17 after ramming into a critical technical resistance confluence. Merge-led Ethereum price breakout ETH’s price dropped by 1.8% to $1,328 after struggling to move above two strong resistance levels: the 50-day exponential moving average (5-day EMA; the red wave) and a descending trendline (black) serving as a price ceiling since May. ETH/USD daily price chart. Source: TradingView Previously, Ether rallied by over 40% from $1,000 on July 13 to over $1,400 on July 16. The jump appeared partly due to euphoria surrounding “the Merge” slated for September. Meanwhile, a golden cross’s appearance on Ethereum’s four-hour chart also boosted Ether’s upside sentiment among technical a...
Bitcoin fights key trendline near $20K as US dollar index hits new 20-year high
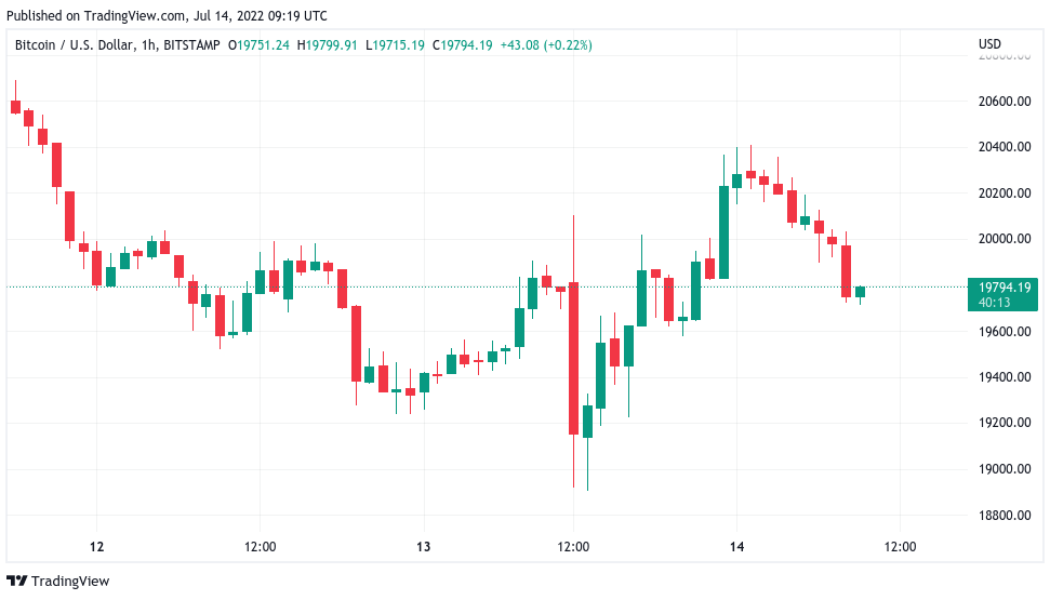
Bitcoin (BTC) found a new focus just under $20,000 on July 14 as U.S. dollar strength hammered out yet another two-decade high. BTC/USD 1-hour candle chart (Bitstamp). Source: TradingView DXY moves bring yen, euro into focus Data from Cointelegraph Markets Pro and TradingView showed BTC/USD rebounding from lows sparked by a fresh 40-year high for U.S. inflation as per the Consumer Price Index (CPI). After briefly dipping under $19,000, the pair took a flight above $20,000 before consolidating immediately below that psychologically significant level. For on-chain analytics resource Material Indicators, it was now “do or die” for BTC price action when it came to a key rising trendline in place since mid-June. On the day, that trendline stood at around $19,600, with BTC/USD n...
Terra’s LUNA2 skyrockets 70% in nine days despite persistent sell-off risks
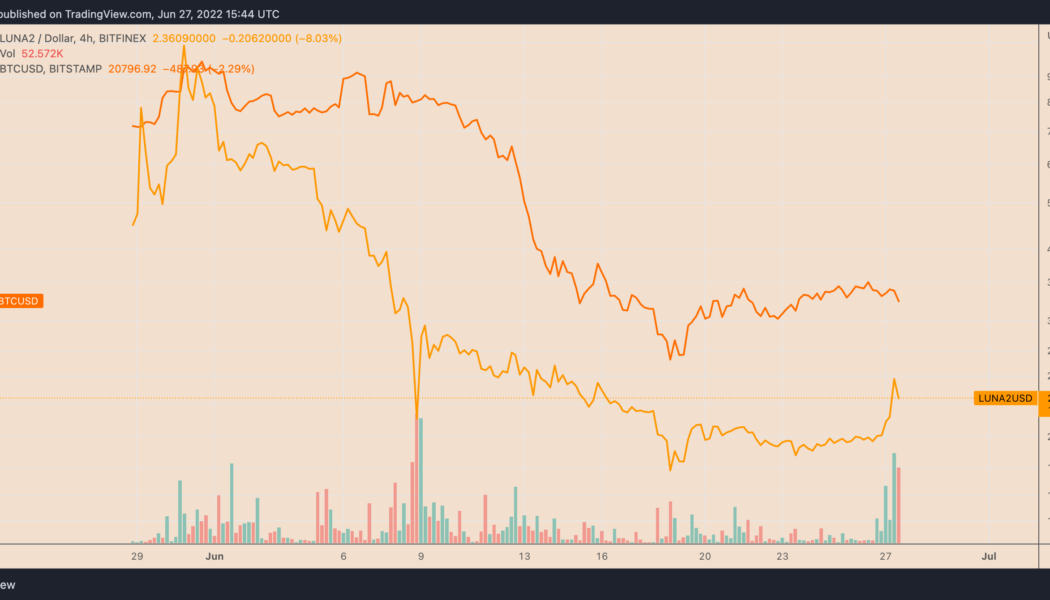
The price of Terra (LUNA2) has recovered sharply nine days after falling to its historic lows of $1.62. On June 27, LUNA2’s rate reached $2.77 per token, thus chalking up a 70% recovery when measured from the said low. Still, the token traded 77.35% lower than its record high of $12.24, set on May 30. LUNA2’s recovery mirrored similar retracement moves elsewhere in the crypto industry with top crypto assets Bitcoin (BTC) and Ether (ETH) rising by approximately 25% and 45% in the same period. LUNA2/USD four-hour price chart versus BTC/USD. Source: TradingView LUNA2 price rally could trap bulls The recent bout of buying in the LUNA2 market could trap bulls, given it has come as a part of a broader correction trend. In detail, LUNA2 appears to be forming a “bear flag&#...
