ETH/BTC
The floppening? Ethereum price weakens post-Merge, risking 55% drop against Bitcoin
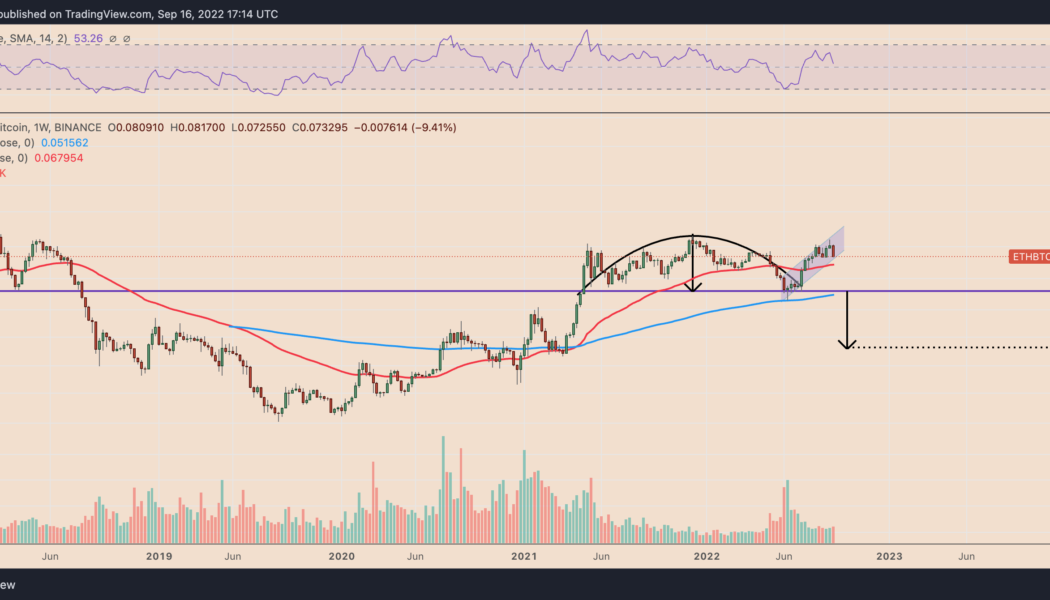
Ethereum’s native token Ether (ETH) has been forming an inverse-cup-and-handle pattern since May 2021 on the weekly chart, which hints at a potential decline against Bitcoin (BTC). ETH/BTC weekly price chart featuring inverse cup-and-handle breakdown setup. Source: TradingView An inverse cup-and-handle is a bearish reversal pattern, accompanied by lower trading volume. It typically resolves after the price breaks below its support level, followed by a fall toward the level at a length equal to the maximum height between the cup’s peak and the support line. Applying the theoretical definition on ETH/BTC’s weekly chart presents 0.03 BTC as its next downside target, down around 55% from Sept. 16’s price. Can ETH/BTC pull a Dow Jones? Alternatively, the ...
Ethereum price rises by 50% against Bitcoin in one month — but there’s a catch
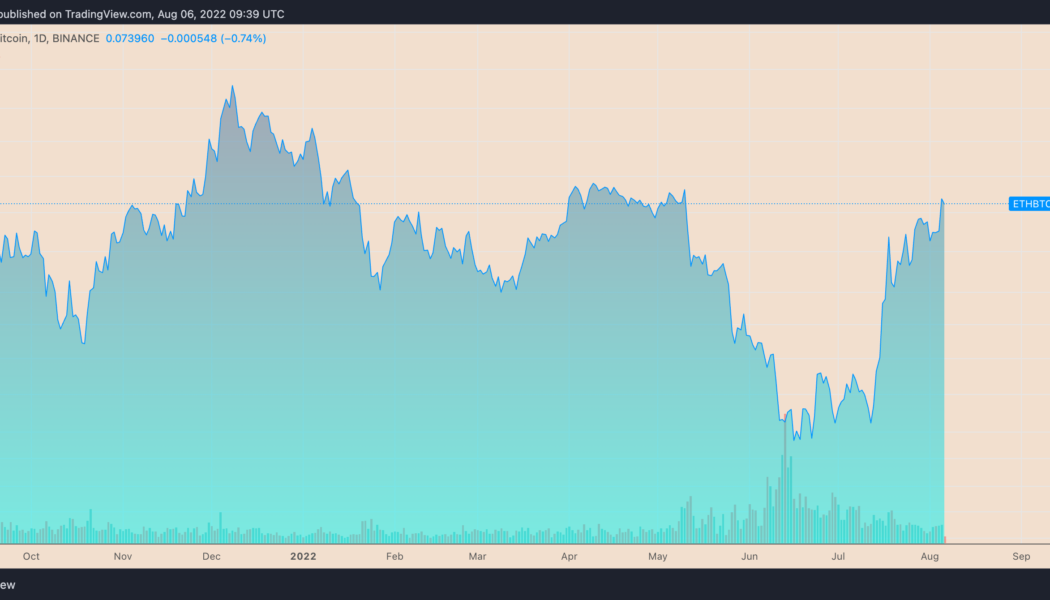
Ether (ETH), Ethereum’s native toke, has been continuing its uptrend against Bitcoin (BTC) as euphoria around its upcoming network upgrade, “the Merge,” grows. ETH at multi-month highs against BTC On the daily chart, ETH/BTC surged to an intraday high of 0.075 on Aug. 6, following a 1.5% upside move. Meanwhile, the pair’s gains came as a part of a broader rebound trend that started a month ago at 0.049, amounting to approximately 50% gains. ETH/BTC daily price chart. Source: TradingView The ETH/BTC recovery in part has surfaced due to the Merge, which will have Ethereum switch from proof-of-work (PoW) mining to proof-of-stake (PoS). Ethereum’s “rising wedge” suggests sell-off From a technical perspective, Ether stares at potential interim loss...
Ethereum price ‘cup and handle’ pattern hints at potential breakout versus Bitcoin
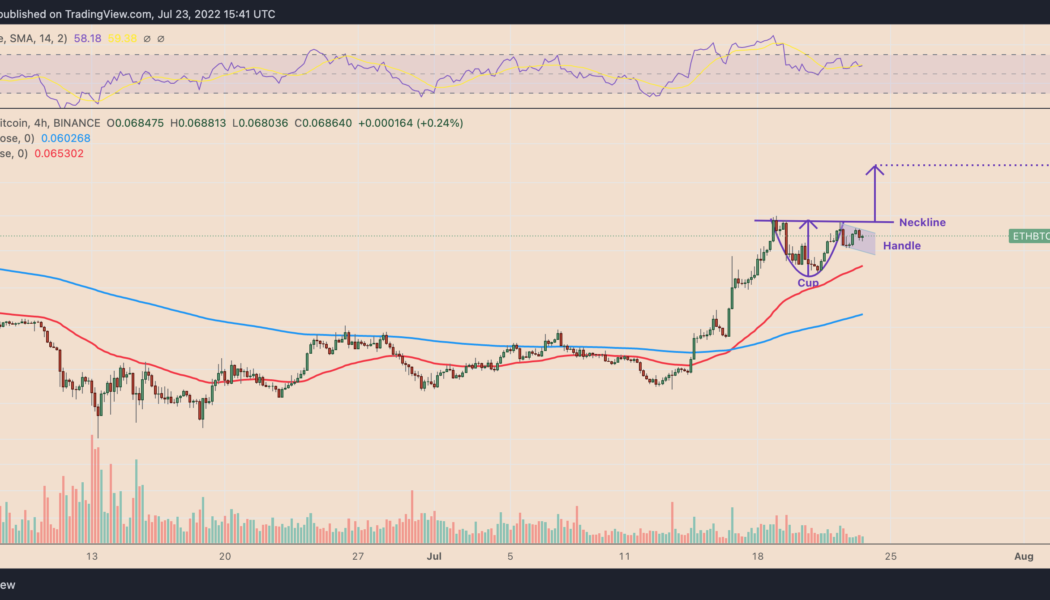
Ethereum’s native token Ether (ETH) has rebounded 40% against Bitcoin (BTC) after bottoming out locally at 0.049 on June 13. Now, the ETH/BTC pair is at two-month highs and can extend its rally in the coming weeks, according to a classic technical pattern. ETH paints cup and handle pattern Specifically, ETH/BTC has been forming a “cup and handle” on its lower-timeframe charts since July 18. A cup and handle setup typically appears when the price falls and then rebounds in what appears to be a U-shaped recovery, which looks like a “cup.” Meanwhile, the recovery leads to a pullback move, wherein the price trends lower inside a descending channel called the “handle.” The pattern resolves after the price rallies to an approximately equal size to ...
How low can Ethereum price drop versus Bitcoin amid the DeFi contagion?
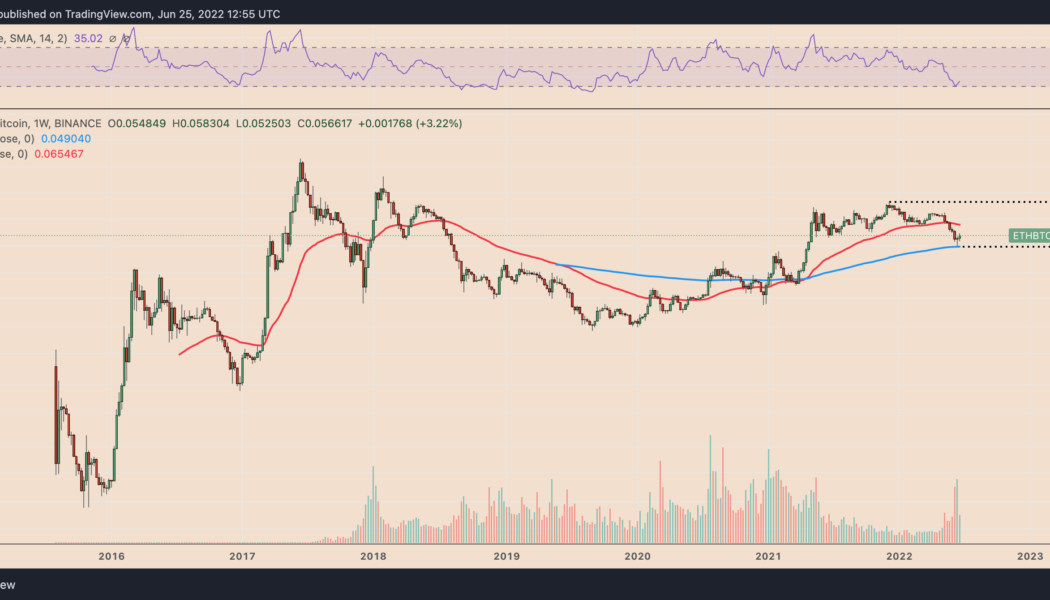
Ethereum’s native token Ether (ETH) has declined by more than 35% against Bitcoin (BTC) since December 2021 with a potential to decline further in the coming months. ETH/BTC weekly price chart. Source: TradingView ETH/BTC dynamics The ETH/BTC pair’s bullish trends typically suggest an increasing risk appetite among crypto traders, where speculation is more focused on Ether’s future valuations versus keeping their capital long-term in BTC. Conversely, a bearish ETH/BTC cycle is typically accompanied by a plunge in altcoins and Ethereum’s decline in market share. As a result, traders seek safety in BTC, showcasing their risk-off sentiment within the crypto industry. Ethereum TVL wipe-out Interest in the Ethereum blockchain soared during the pandemic as developer...
Ethereum eyes fresh yearly lows vs. Bitcoin as bulls snub successful ‘Merge’ rehearsal
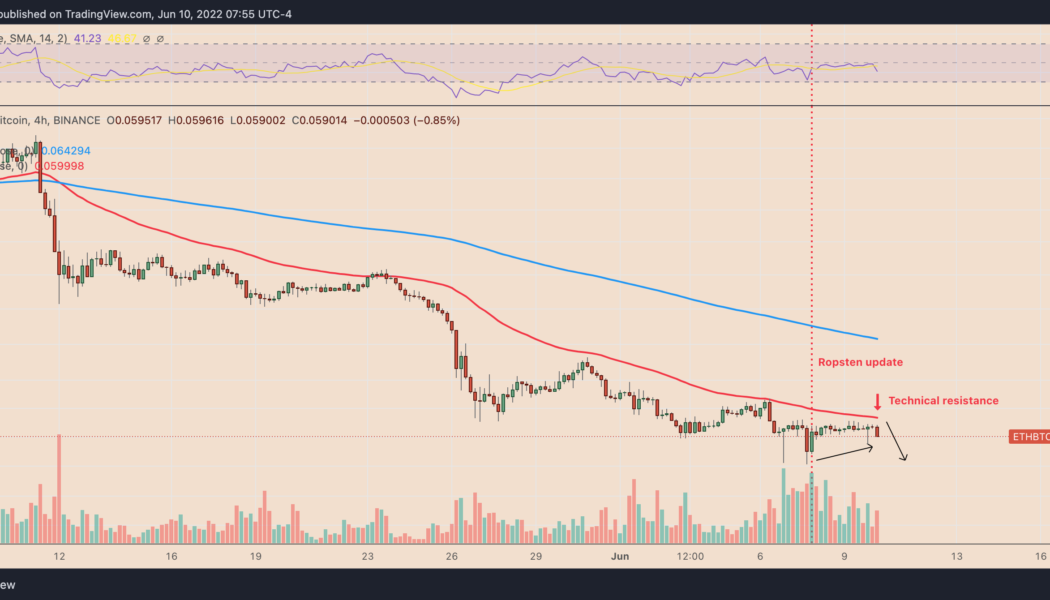
Ethereum’s native token Ether (ETH) resumed its decline against Bitcoin (BTC) two days after a successful rehearsal of its proof-of-stake (PoS) algorithm on its longest-running testnet “Ropsten.” The ETH/BTC fell by 2.5% to 0.0586 on June 10. The pair’s downside move came as a part of a correction that had started a day before when it reached a local peak of 0.0598, hinting at weaker bullish sentiment despite the optimistic “Merge” update. ETH/BTC four-hour price chart. Source: TradingView Interestingly, the selloff occurred near ETH/BTC’s 50-4H exponential moving average (50-4H EMA; the red wave) around 0.06. This technical resistance has been capping the pair’s bullish attempts since May 12, as shown in the chart above. Staked Ether behind ...
