DXY
Bitcoin’s inverse correlation with US dollar hits 17-month highs — what’s next for BTC?
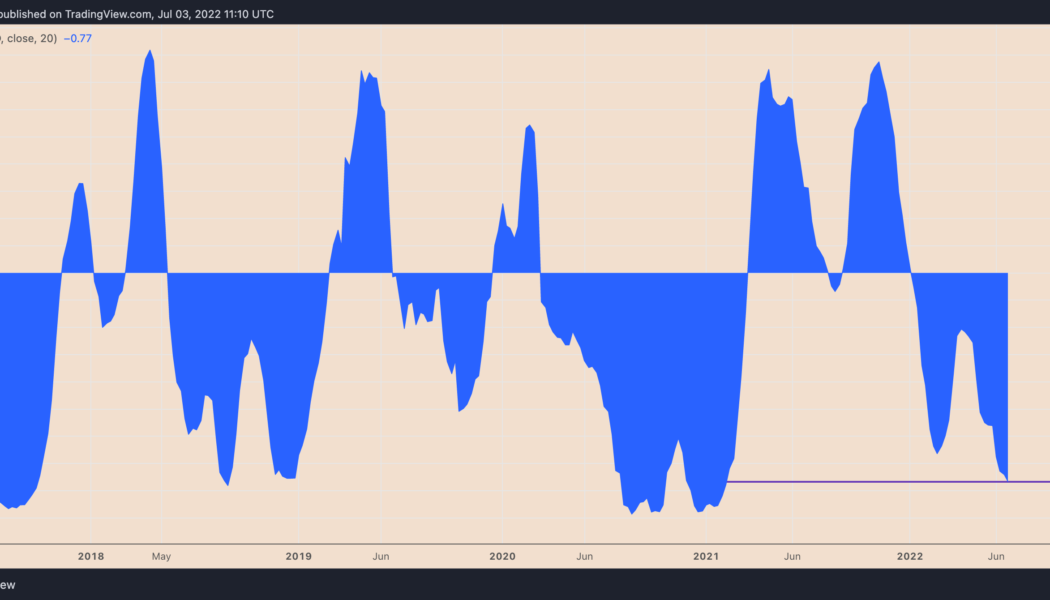
Bitcoin (BTC) has been moving in the opposite direction of the U.S. dollar since the beginning of 2022 — and now that inverse relationship is more extreme than ever. Bitcoin and the dollar go in opposite ways Notably, the weekly correlation coefficient between BTC and the dollar dropped to 0.77 below zero in the week ending July 3, its lowest in seventeen months. Meanwhile, Bitcoin’s correlation with the tech-heavy Nasdaq Composite reached 0.78 above zero in the same weekly session, data from TradingView shows. BTC/USD and U.S. dollar correlation coefficient. Source: TradingView That is primarily because of these markets’ year-to-date performances amid the fears of recession, led by the Federal Reserve’s benchmark rate hikes to curb rising inflation. Bitcoin, for example,...
Weaker dollar lifts Bitcoin to $30.7K as analyst eyes 60% BTC dominance
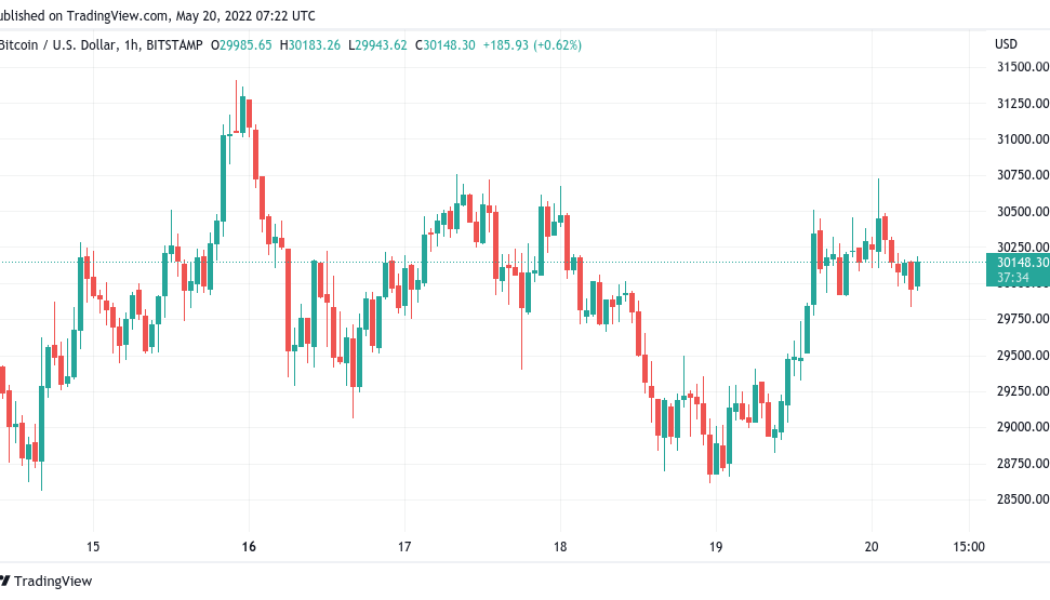
Bitcoin (BTC) hit 48-hour highs overnight into May 20 as U.S. dollar weakness gave bulls some much-needed respite. BTC/USD 1-hour candle chart (Bitstamp). Source: TradingView Dollar strength declines after 20-year record Data from Cointelegraph Markets Pro and TradingView recorded a high of $30,725 for BTC/USD on Bitstamp. Still struggling to flip $30,000 to reliable support, the pair nonetheless avoided a deeper retracement, helping calm fears that last week’s $23,800 capitulation event did not mark the bottom. The U.S. dollar index (DXY) provided the background to Bitcoin’s relatively solid performance, this coming off two-decade highs to dip 2% in a week. This appeared to relieve some pressure on stock markets, the S&P 500 finishing May 19 down a more modest 0.58% compared to previo...
Bitcoin rises above $51K as the dollar flexes muscles against the euro
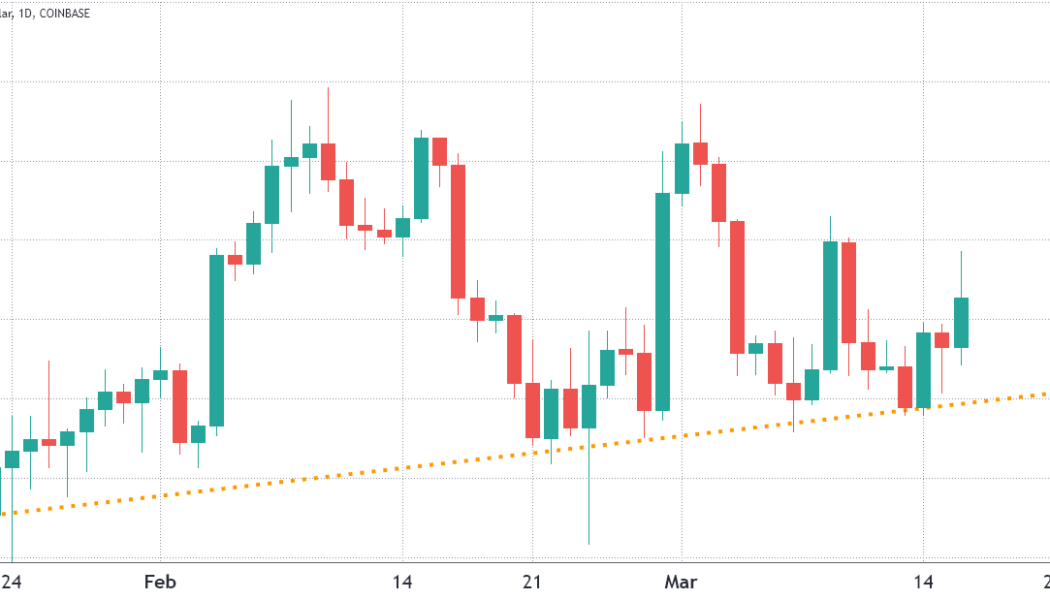
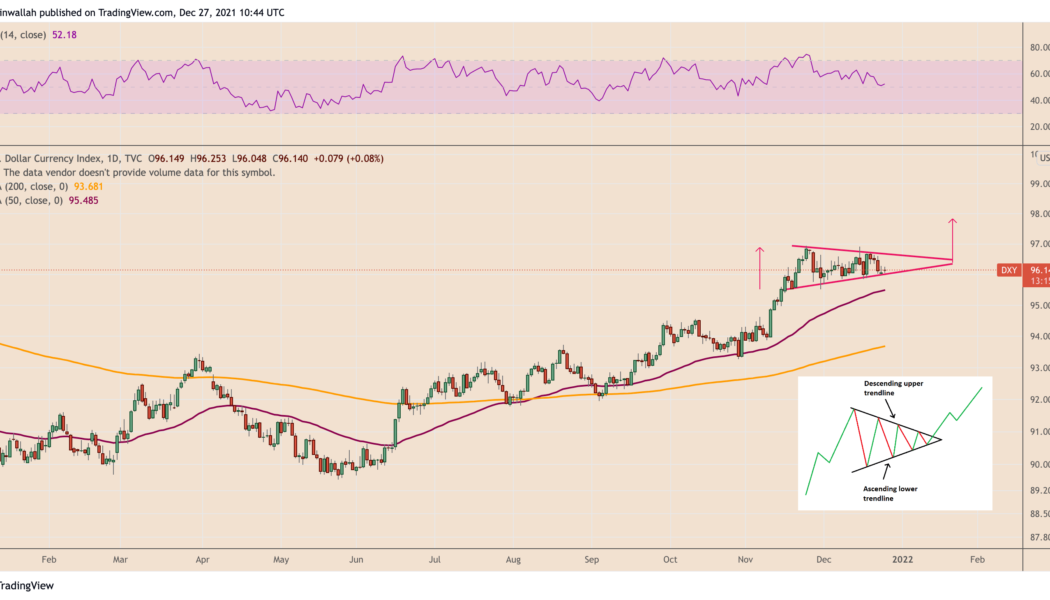
Bitcoin (BTC) regained its bullish strength after reclaiming $50,000 last week and continued to hold the psychological level as support on Dec. 27. Meanwhile, its rival for the top safe-haven spot, the U.S. dollar, also bounced off a critical price floor, hinting that it would continue rallying through into 2022. Triangle breakout The U.S. dollar index (DXY), which measures the greenback’s strength against a basket of top foreign currencies, has been trending towards the apex of a “symmetrical triangle” pattern on its daily chart. In doing so, the index has been treating the structure’s lower trendline as its solid support level, thus hinting that its next breakout would resolve to the upside. DXY daily price chart featuring symmetrical triangle setup. Source: Tradi...
- 1
- 2
