Dogecoin Price
Bitcoin spoofs $39.5K breakout at Wall St open as Elon Musk Twitter takeover nears
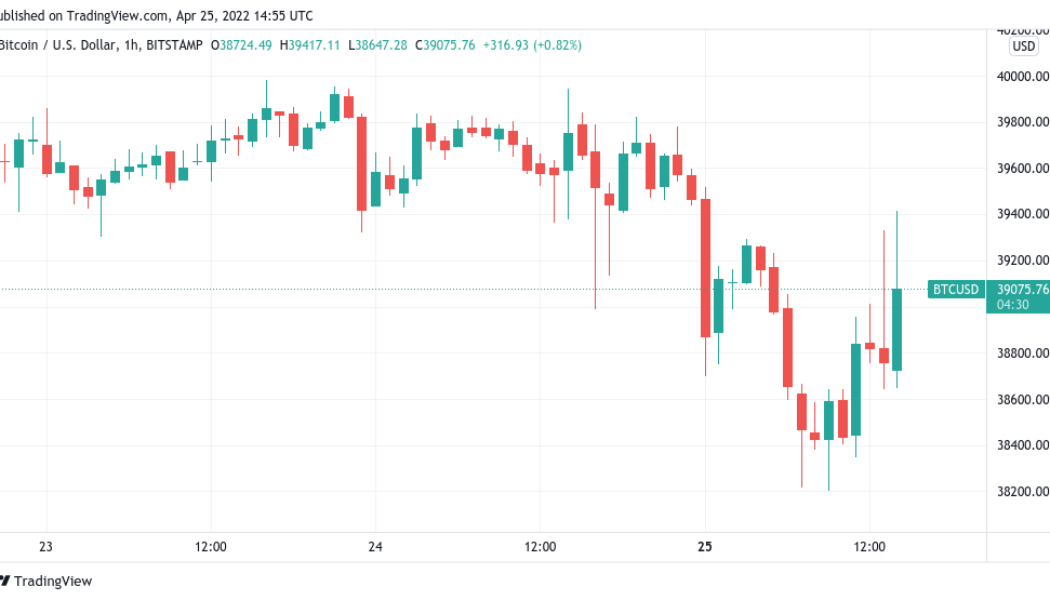
Bitcoin (BTC) saw a classic “fakeout” move on April 25 as volatility kept traders firmly on edge. BTC/USD 1-hour candle chart (Bitstamp). Source: TradingView Traders stay gloomy on BTC outlook Data from Cointelegraph Markets Pro and TradingView showed BTC/USD briefly climbing almost $1,000 as Monday’s Wall Street trading session began. The move was short-lived, the pair coming back down to where it started within an hour after hitting local highs of $39,517 on Bitstamp. Monday had begun with a whimper for Bitcoin bulls, who lost ground on the weekly close and failed to avoid $40,000 flipping to resistance on daily timeframes. For popular trader Crypto Ed, $30,000 was still on the table as a potential short-term target. “To me, it seems any bounce we...
Shiba Inu (SHIB) fetches 30% gain on Robinhood listing rumor and bullish chart pattern
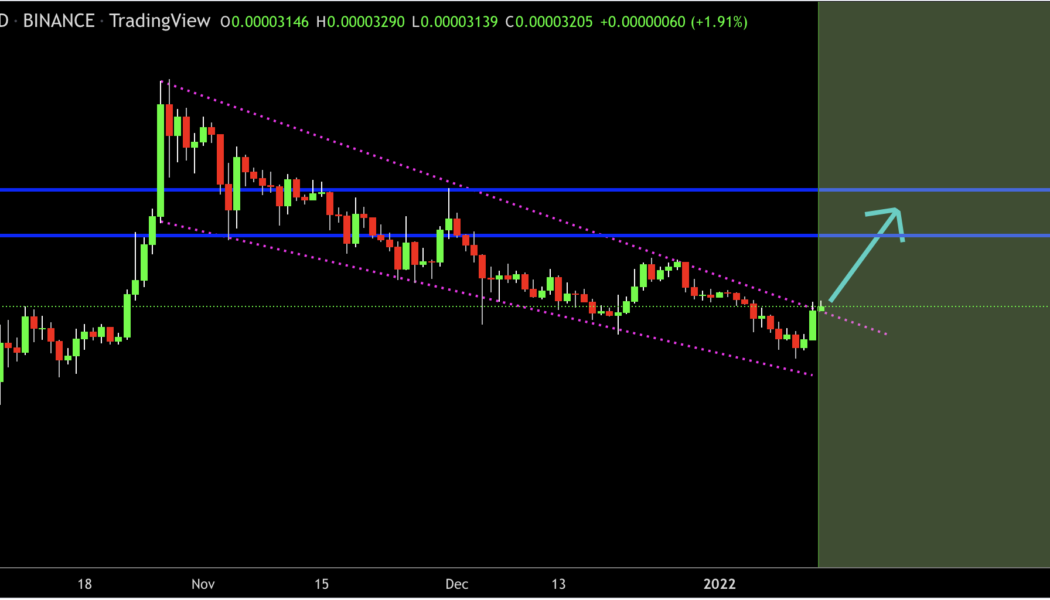
Shiba Inu (SHIB) seems to be preparing for a bullish breakout as a falling wedge pattern begins to form. The price of SHIB has been trending lower inside an area defined by two contracting trendlines while accompanying a decline in trading volume. That shows that investors have been less concerned about the downtrend. As a result, falling wedges typically provide an ideal springboard for an upside break once the price closes above the structure’s upper trendline. On Thursday, SHIB showed signs of following a similar topside break. SHIB/USDT daily price chart featuring a falling wedge. Source: Fiery Trading Notably, the token briefly closed above the falling wedge’s upper trendline, hitting an intraday high of $0.00003290. The upside move raised anticipati...


