Death Cross
Solana’s weekend bounce risks turning into a bull trap — Can SOL price fall to $60 next?
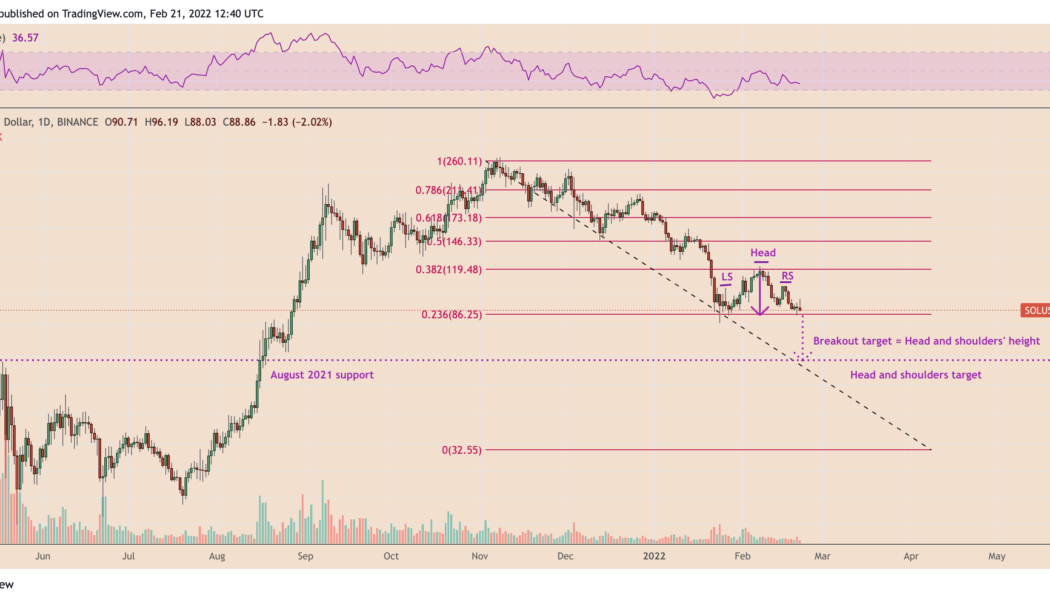
A rebound move witnessed in the Solana (SOL) market this weekend exhausted midway as its price dropped below the $90 level from a high of $96 on Feb. 21. In doing so, SOL price technicals are now risking a classic bearish reversal setup. Solana price risks dropping to $60 Dubbed head-and-shoulders (H&S), the technical pattern emerges when the price forms three peaks in a row atop a common support level (called a neckline). As it typically turns out, the pattern’s middle peak, called a “head,” comes longer than the other two peaks, called theleft and right shoulders, which come to be of similar heights. The H&S pattern tends to send the prices lower—at length equal to the maximum distance between the head and the neckline—once they decisively break below its ...
Will this time be different? Bitcoin eyes drop to $35K as BTC price paints ‘death cross’
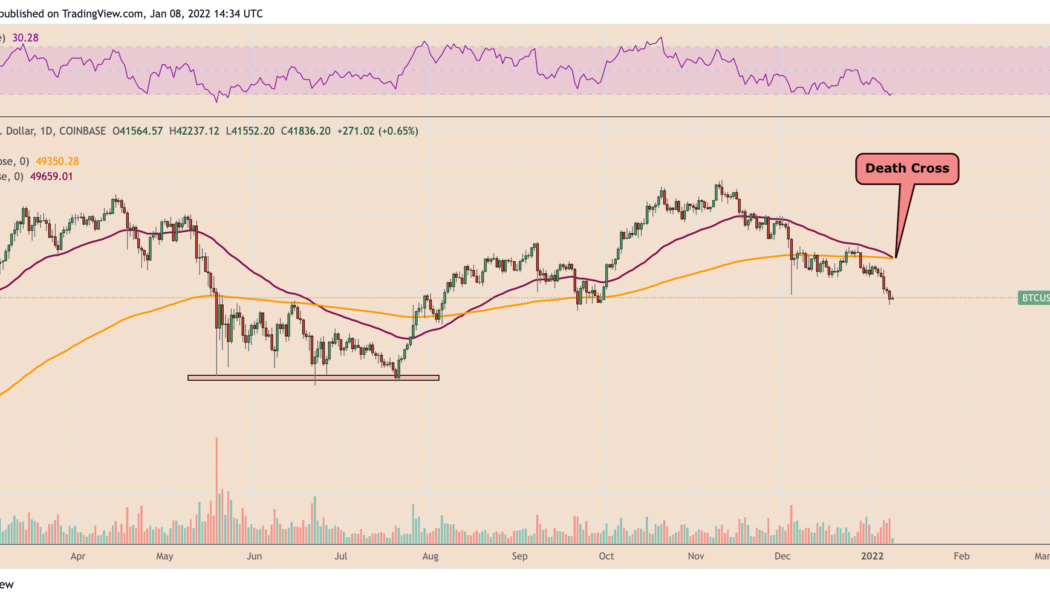
Bitcoin (BTC) formed a trading pattern on Jan. 8 that is widely watched by traditional chartists for its ability to anticipate further losses. In detail, the cryptocurrency’s 50-day exponential moving average (50-day EMA) fell below its 200-day exponential moving average (200-day EMA), forming a so-called “death cross.” The pattern appeared as Bitcoin underwent a rough ride in the previous two months, falling over 40% from its record high of $69,000. BTC/USD daily price chart. Source: TradingView Death cross history Previous death crosses were insignificant to Bitcoin over the past two years. For instance, a 50-200-day EMA bearish crossover in March 2020 appeared after the BTC price had fallen from nearly $9,000 to below $4,000, turning out to be lagging than predictive. ...


