BTC
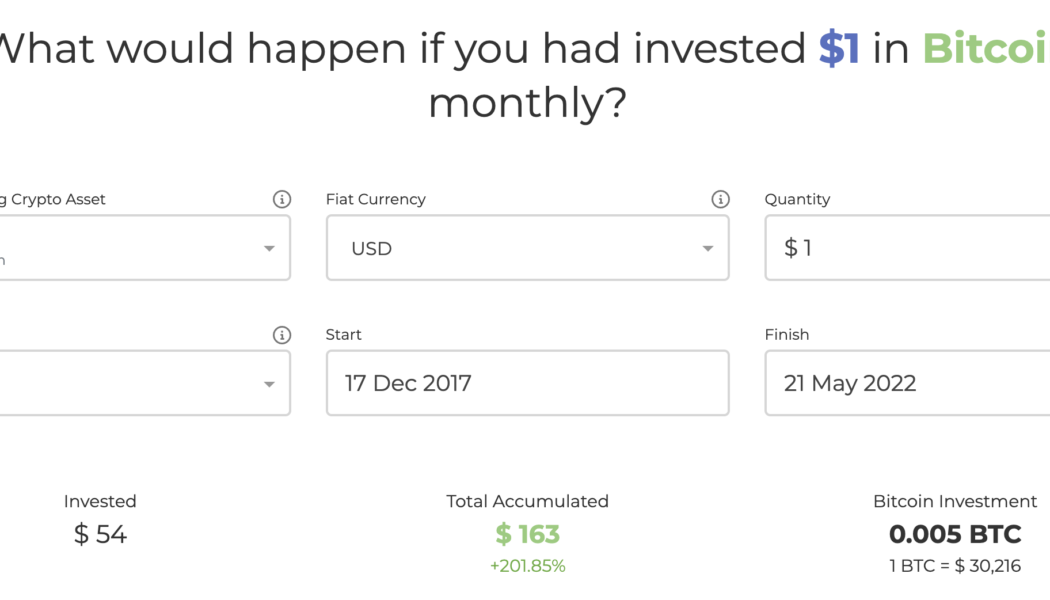
Dollar Cost Averaging or Lump-sum: Which Bitcoin strategy works best regardless of price?
Bitcoin (BTC) has declined by more than 55% six months after it reached its record high of $69,000 in November 2021. The massive drop has left investors in a predicament about whether they should buy Bitcoin when it is cheaper, around $30,000, or wait for another market selloff. The more you look at prior $BTC price history the more one can think it’s not the bottom After 190 days from the all-time high, Bitcoin still had another 150 to 200 days until it hit bottom last couple of cycles (red box) If time is any indicator, could be another 6 to 8 months pic.twitter.com/C1YHnfOzxC — Rager (@Rager) May 20, 2022 This is primarily because interest rates are lower despite Federal Reserve’s recent 0.5% rate hike. Meanwhile, cash holdings among the global fund managers have surged ...
Ethereum in danger of 25% crash as ETH price forms classic bearish technical pattern
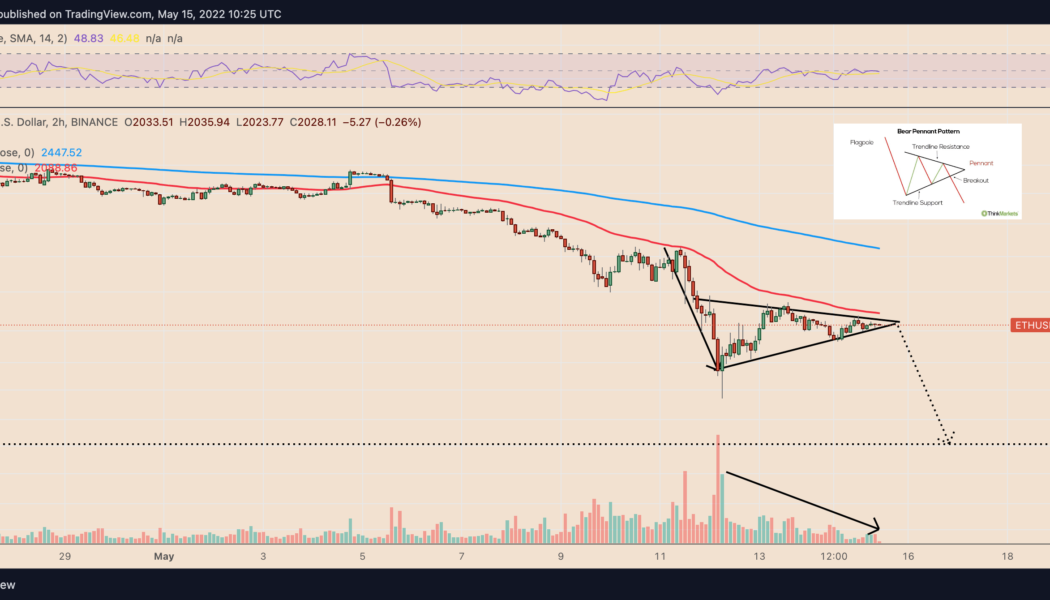
Ethereum’s native token Ether (ETH) looks ready to undergo a breakdown move in May as it forms a convincing “bear pennant” structure. ETH price to $1,500? ETH’s price has been consolidating since May 11 inside a range defined by two converging trendlines. Its sideways move coincides with a drop in trading volumes, underscoring the possibility that ETH/USD is painting a bear pennant. Bear pennants are bearish continuation patterns, meaning they resolve after the price breaks below the structure’s lower trendline and then falls by as much as the height of the previous move downside (called the flagpole). ETH/USD two-hour price chart. Source: TradingView As a result of this technical rule, Ether risks closing below its pennant structure, followed by additional mo...
$1.9T wipeout in crypto risks spilling over to stocks, bonds — stablecoin Tether in focus
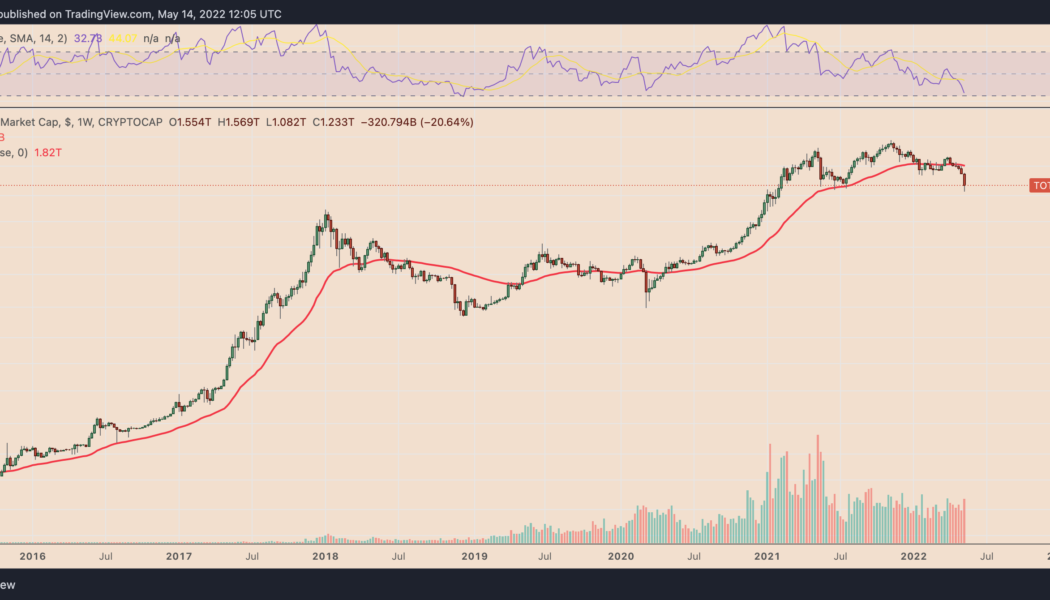
The cryptocurrency market has lost $1.9 trillion six months after it soared to a record high. Interestingly, these losses are bigger than those witnessed during the 2007’s subprime mortgage market crisis — around $1.3 trillion, which has prompted fears that creaking crypto market risk will spill over across traditional markets, hurting stocks and bonds alike. Crypto market capitalization weekly chart. Source: TradingView Stablecoins not very stable A massive move lower from $69,000 in November 2021 to around $24,300 in May 2022 in Bitcoin’s (BTC) price has caused a selloff frenzy across the crypto market. Unfortunately, the bearish sentiment has not even spared stablecoins, so-called crypto equivalents of the U.S. dollar, which have been unable to stay as “stable” a...
Three new crypto ETFs to begin trading in Australia this week
Australians will soon have more options for spot cryptocurrency exchange-traded funds (ETFs) after a previous hold-up was given the green light this week and new funds entered the ETF market. The latest update came late on May 9 as Cboe Australia issued a round of market notices that three funds previously delayed are expected to begin trading on Thursday, May 12. They include a Bitcoin ETF from Cosmos Asset Management, plus Bitcoin (BTC) and Ethereum (ETH) spot ETFs from 21Shares. Cboe Australia and Cosmos did not immediately respond to a request for comment, but a spokesperson from 21Shares confirmed to Cointelegraph: “We’re listing on May 12, this Thursday. The downstream issues are resolved.” On April 26, a day before three of the first crypto ETFs were set to launch, the Cboe Au...
Monero avoids crypto market rout, but XMR price still risks 20% drop by June
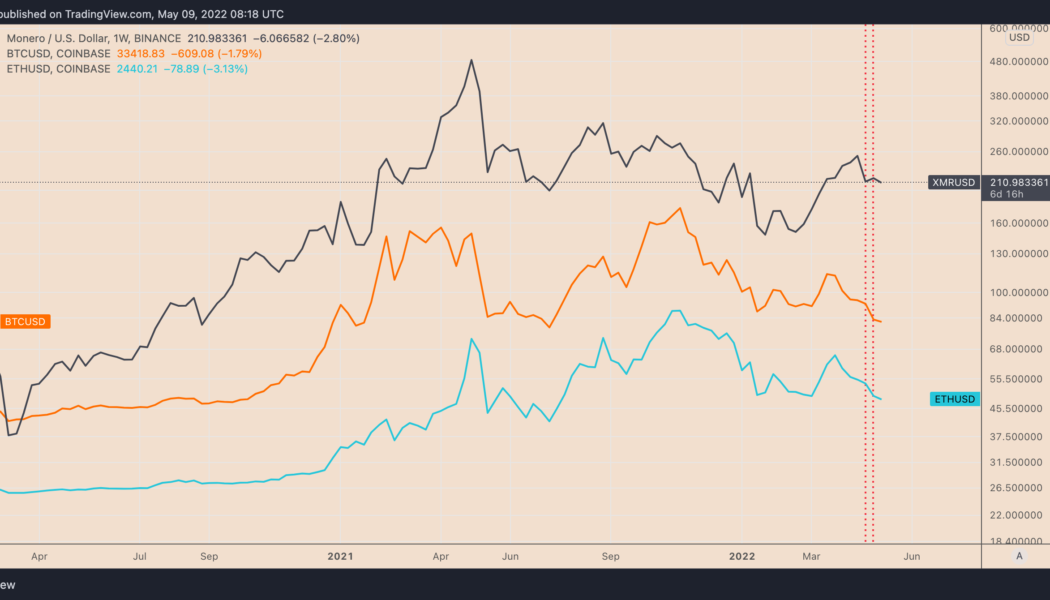
Monero (XMR) has shown a surprising resilience against the United States Federal Reserve’s hawkish policies that pushed the prices of most of its crypto rivals — including the top dog Bitcoin (BTC) — lower last week. XMR price closed the previous week 2.37% higher at $217, data from Binance shows. In comparison, BTC, which typically influences the broader crypto market, finished the week down 11.55%. The second-largest crypto, Ether (ETH), also plunged 11% in the same period. XMR/USD vs. BTC/USD vs. ETH/USD weekly price chart. Source: TradingView While the crypto market wiped off $163.25 billion from its valuation last week, down nearly 9%, Monero’s market cap increased by $87.7 million, suggesting that many traders decided to seek safety in this privacy-focused coin. XMR near ...
Bitcoin nervously awaits Fed as Paul Tudor Jones says ‘clearly don’t own’ stocks, bonds
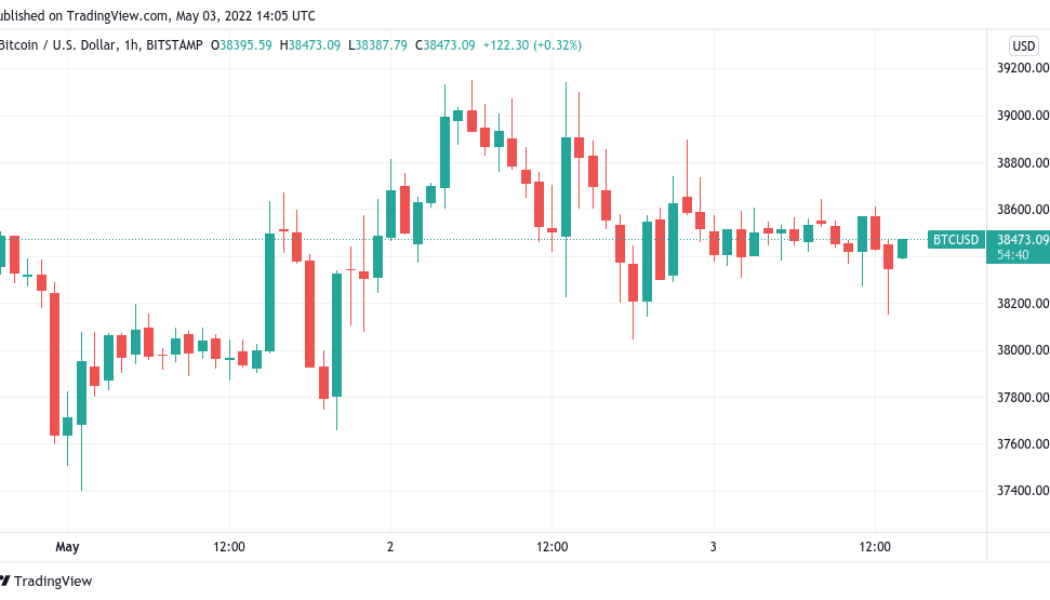
Bitcoin (BTC) kept investors guessing on May 3 as markets awaited May 4’s Federal Reserve comments. BTC/USD 1-hour candle chart (Bitstamp). Source: TradingView Tudor Jones says “no thanks” to stocks, bonds Data from Cointelegraph Markets Pro and TradingView showed BTC/USD hovering just above $38,000 at May 3’s Wall Street open. The pair had stayed practically static over 24 hours to the time of writing as volatility in stocks dictated the mood. Amid multiple calls for a “capitulation” style event to hit both crypto and TradFi markets, there was an eerie sense of calm leading up to the Federal Open Markets Committee (FOMC) meeting, with news on U.S. rate hikes to follow. Everyone is waiting for Jerome Powell to come up tomorrow to have a speech...
Purpose Bitcoin ETF adds 1.1K BTC as data hints investors want to ‘buy the dip’
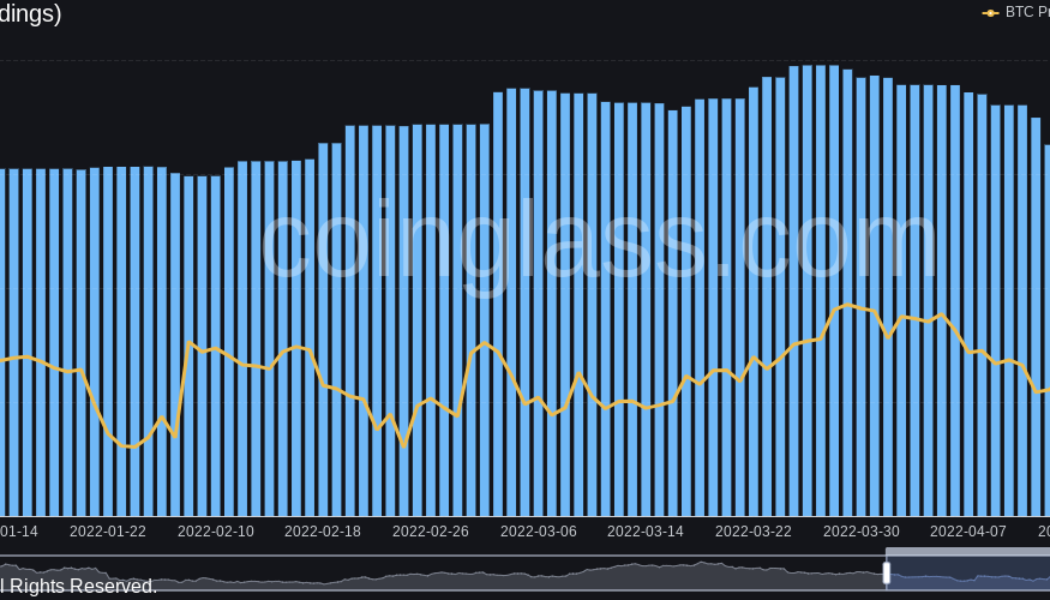
The world’s first Bitcoin (BTC) spot price exchange-traded fund (ETF) is buying BTC again after a month of selling. Data from on-chain monitoring resource Coinglass confirms that on April 27, Canada’s Purpose Bitcoin ETF added 1,132 BTC to its holdings. Data: Buy the dip interest “skyrocketing” Despite fears that Bitcoin is not yet done with its sell-off, an about turn at Purpose hints at increasing institutional demand. Beginning March 28, when BTC/USD traded above $48,000, Purpose began reducing its exposure, which at the time totaled 36,321 BTC. Wednesday’s increase is thus the first since March 25. At the time of writing, Purpose held 31,162.7 BTC, while BTC/USD traded at $39,000. Purpose Bitcoin ETF BTC holdings chart. Source: Coinglass The move coincides with figures from...
Could XRP price lose another 70% by Q3?
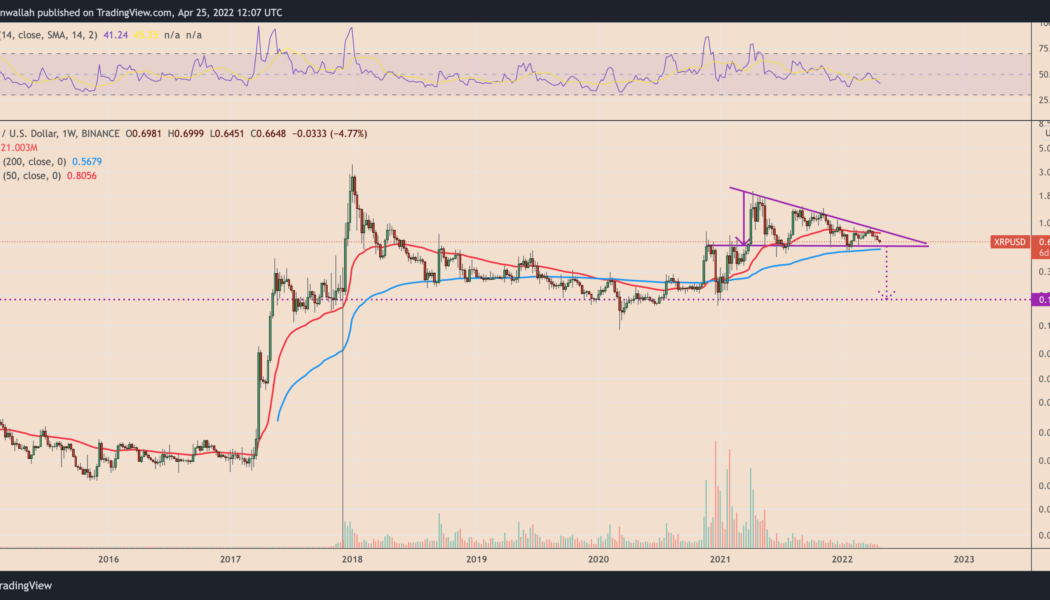
Ripple (XRP) continued its correction trend on April 25, falling by 5.5% to reach $0.64, its lowest level since Feb. 28. More XRP price downside ahead? The plunge increased the possibility of triggering a bearish reversal setup called descending triangle. While these patterns form usually during a downtrend, their occurrences following strong bullish moves usually mark the end of the uptrend. XRP has been in a similar trading channel since April 2022, bounded by two trendlines: a lower horizontal and an upper downward sloping. The pattern now nears its resolve as XRP pulls back toward the support trendline that’s also coinciding with the 50-week exponential moving average (50-week EMA; the blue wave), five weeks after testing the upper trendline as resistance. XRP/USD weekl...
Bitcoin institutional buying ‘could be big narrative again’ as 30K BTC leaves Coinbase
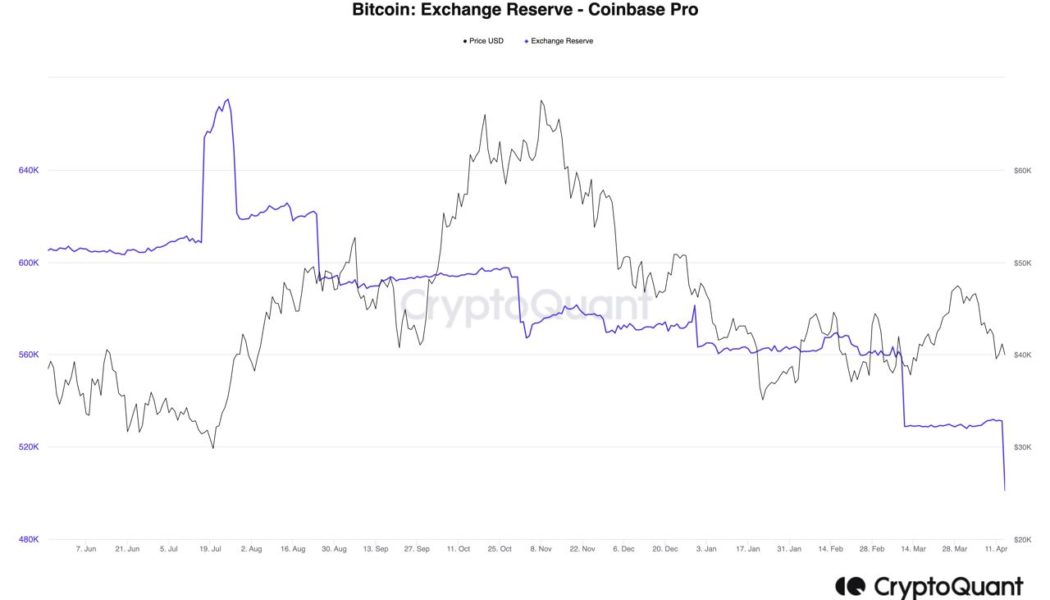
Bitcoin (BTC) may be heading under $40,000 but fresh data shows that demand from major investors is anything but decreasing. For Ki Young Ju, CEO of on-chain analytics platform CryptoQuant, institutional BTC buying “could be the big narrative” in the crypto space once more. Coinbase Pro shifts serious amounts of BTC Ki highlighted figures from Coinbase Pro, the professional trading offshoot of United States exchange Coinbase, which confirm that large tranches of BTC continue to leave its books. Those tranches totalled 30,000 BTC in a single day this week, and the event is not an isolated one, with March seeing similar behavior. Coinbase Pro BTC reserves vs. BTC/USD chart. Source: CryptoQuant “30k BTC flowed out from Coinbase today,” he noted, “Institutional buys might be the bi...
Ethereum price ‘bullish triangle’ puts 4-year highs vs. Bitcoin within reach
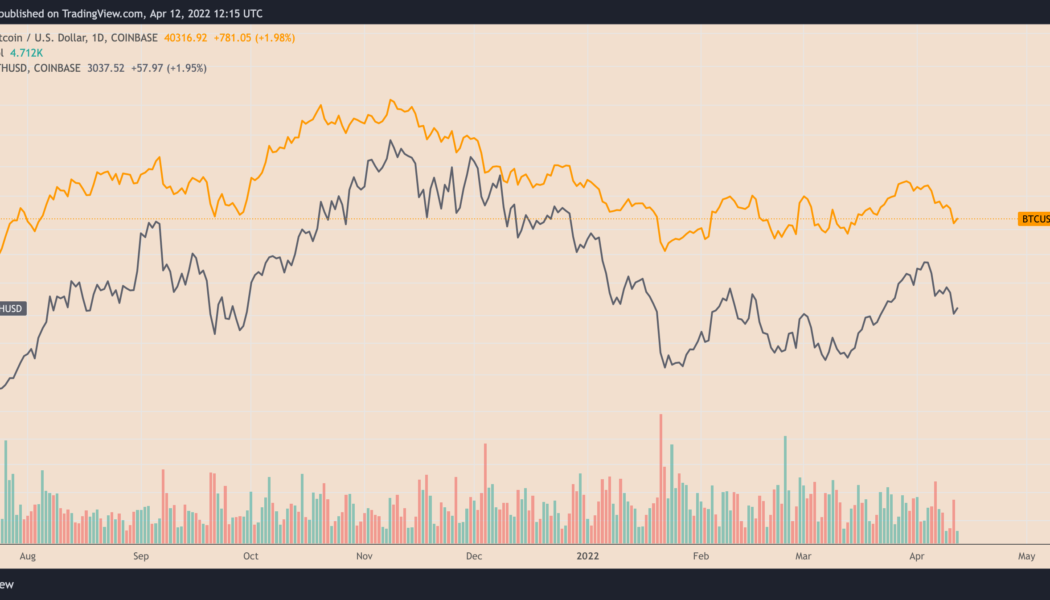
Ethereum’s native token Ether (ETH) has dropped about 17% against the U.S. dollar in the last two weeks. But its performance against Bitcoin (BTC) has been less painful with the ETH/BTC pair down 4.5% over the same period. The pair’s down-move appears as both ETH/USD and BTC/USD drop nearly in lockstep while reacting to the Federal Reserve’s potential to hike rates by 50 basis points and slash its balance sheet by $95 billion per month. The latest numbers released on April 12 show that consumer prices rose 8.5% in March, the most since 1981. BTC/USD vs. ETH/USD daily price chart. Source: TradingView ETH/BTC triangle breakout Several technicals remain bullish despite ETH/BTC dropping in the last two weeks. Based on a classic continuation pattern, the pair still l...
Terra price key support level breaks after 30% weekly drop — more pain for LUNA ahead?
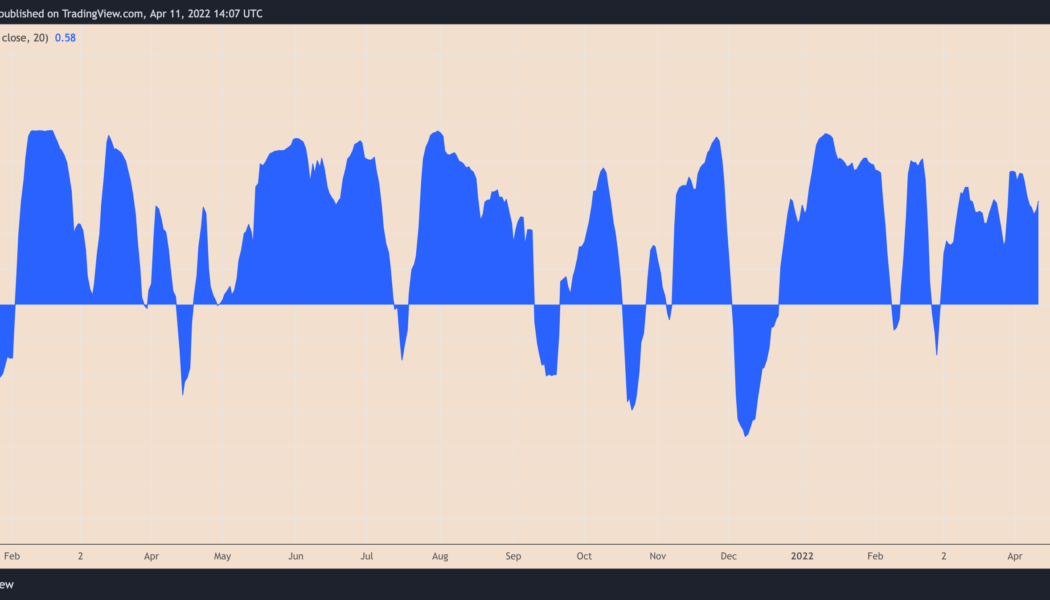
Terra (LUNA) price slid on April 11 as a broader correction across crypto assets added to the uncertainties concerning its token burning mechanism. Bitcoin (BTC) and Ether (ETH) led to a decline in the rest of the cryptocurrency market, with LUNA’s price dropping by over 8% to nearly $91.50, and about 30% from its record high of $120, set on April 6. The overall drop tailed similar moves in the U.S. stock market last week after the Federal Reserve signaled its intentions to raise interest rates and shrink balance sheets sharply to curb rising inflation. Arthur Hayes, the co-founder of BitMEX exchange, said Monday that Bitcoin’s correlation with tech stocks could have it run for $30,000 next. In other words, LUNA’s high correlation with BTC so far this year puts it at risk...
Dogecoin signals bottoming out as DOGE rebounds 30% in two weeks — What’s next?
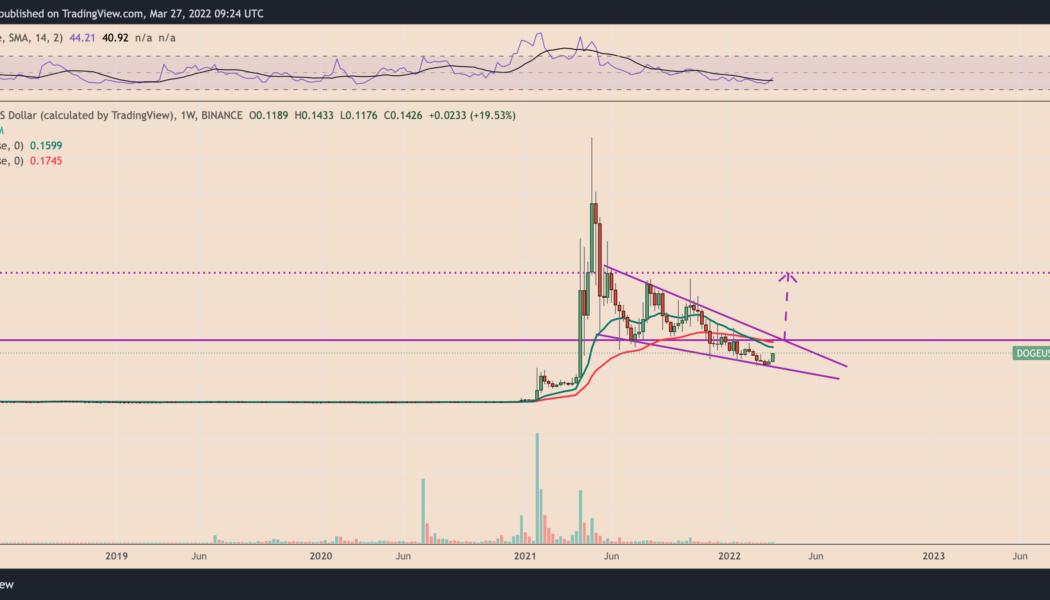
A brutal correction witnessed in the Dogecoin (DOGE) market between May 2021 and February 2022, which saw the price dropping by almost 85%, appears to have come to a halt this month. DOGE/USD rebounds 30% in two weeks DOGE experienced strong dip-buying when its price crashed to levels around $0.10 two weeks ago, resulting in a 30% rebound move to $0.14 as of March 27. Meanwhile, the coin’s upside retracement originated at a support level that constitutes a “falling wedge” setup, signaling an extended bullish reversal in the weekly sessions ahead. In detail, a falling wedge pattern occurs when the price trends lower while fluctuating between two downward sloping, converging trendlines. In a perfect scenario, the setup results into the price breaking out of the descending r...
