BTC USD
Bitcoin price bottom takes shape as ‘old coins’ hit a record 78% of supply
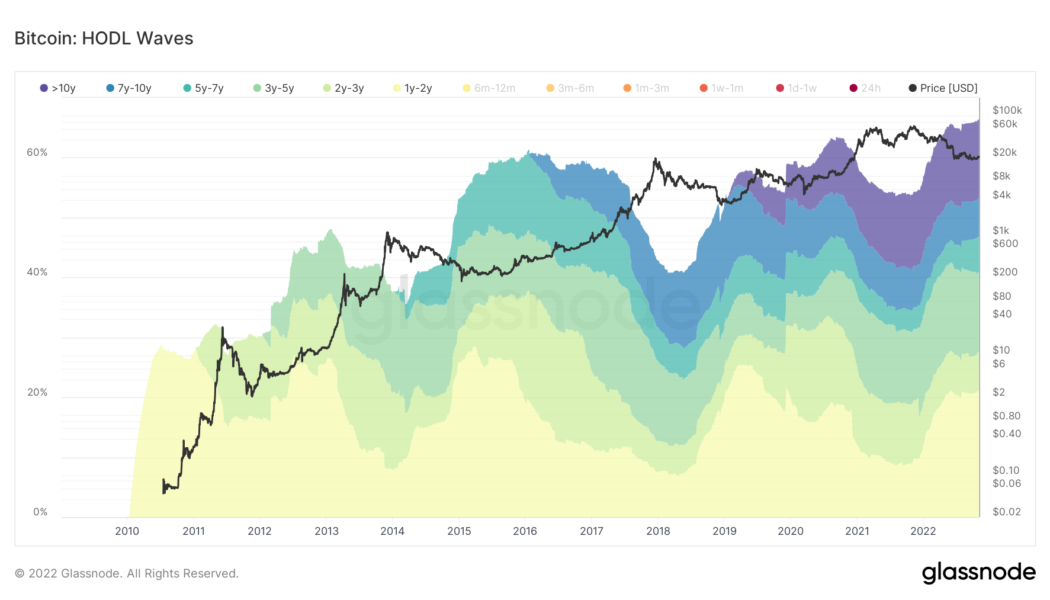
Bitcoin (BTC) and the rest of the crypto market have been in a bear market for almost a year. The top cryptocurrency has seen its market valuation plummet by more than $900 billion in the said period, with macro fundamentals suggesting more pain ahead. Another bear cycle produces more BTC hodlers But the duration of Bitcoin’s bear market has coincided with a substantial rise in the percentage of BTC’s total supply held by investors for at least six months to one year. Notably, the percentage of coins held for at least a year has risen from nearly 54% on Oct. 28, 2021, to a record high of 66% on Oct. 28, 2022, data shows. Bitcoin hodl waves. Source: Glassnode This evidence suggests that long-term investors are increasingly looking at Bitcoin as a store of value, asserts Charles Edward...
Ethereum flashes a classic bullish pattern in its Bitcoin pair, hinting at 50% upside
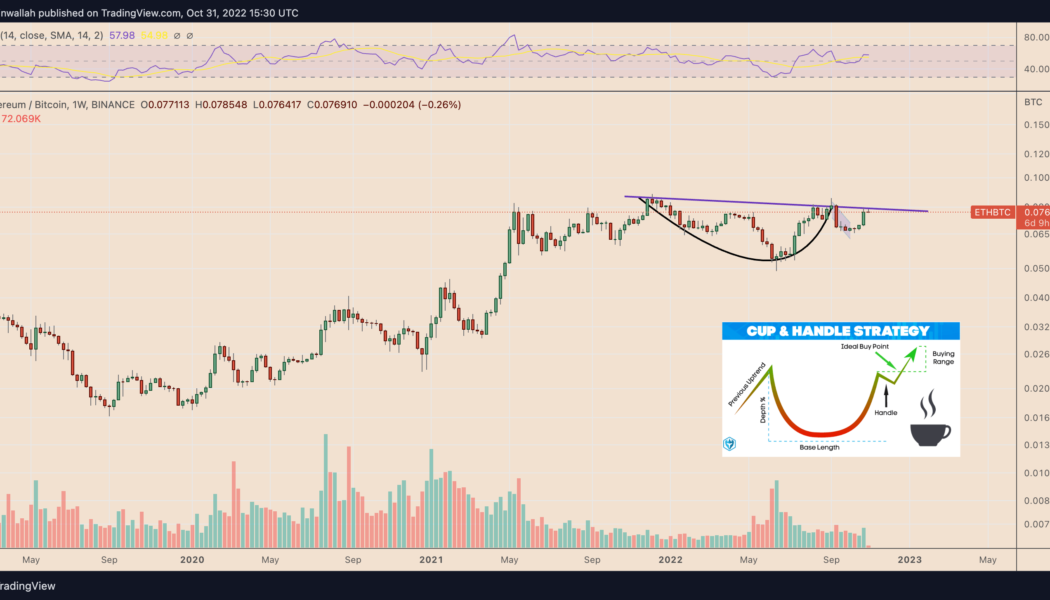
Ethereum’s native token, Ether (ETH), looks poised to log a major price rally versus its top rival, Bitcoin (BTC), in the days leading toward early 2023. Ether has a 61% chance of breaking out versus Bitcoin The bullish cues emerge primarily from a classic technical setup dubbed a “cup-and-handle” pattern. It forms when the price undergoes a U-shaped recovery (cup) followed by a slight downward shift (handle) — all while maintaining a common resistance level (neckline). Traditional analysts perceive the cup and handle as a bullish setup, with veteran Tom Bulkowski noting that the pattern meets its profit target 61% of all time. Theoretically, a cup-and-handle pattern’s profit target is measured by adding the distance between its neckline and lowest point to the neckline level. The Ether-to...
The biggest Bitcoin fund just hit a record -35% discount — A warning for BTC price?
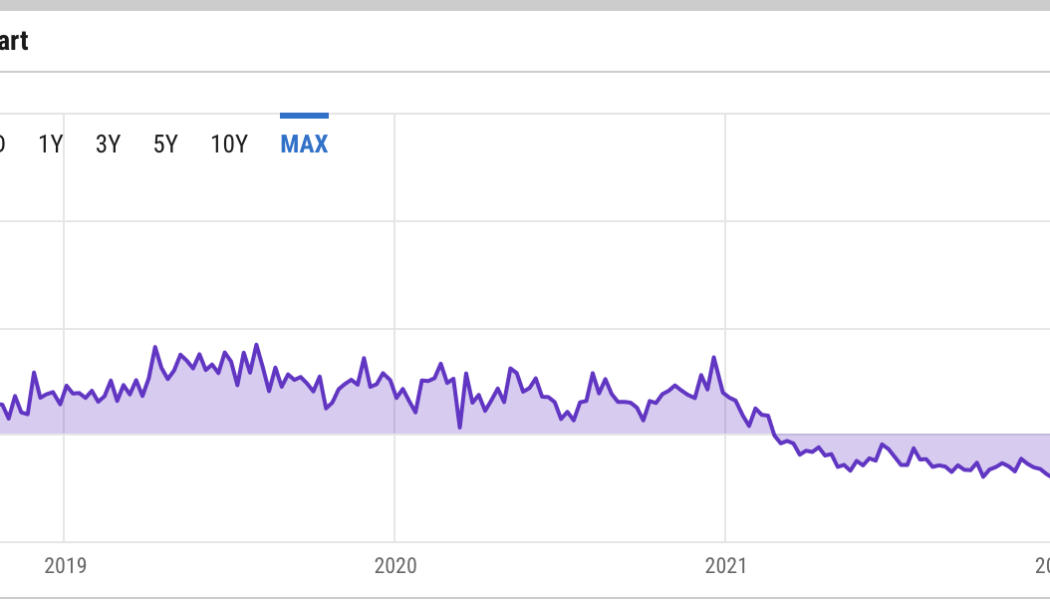
Grayscale Bitcoin Trust (GBTC), a cryptocurrency fund that currently holds 3.12% of the total Bitcoin (BTC) supply, or over 640,000 BTC, is trading at a record discount compared to the value of its underlying assets. Institutional interest in Grayscale dries up On Sep. 23, the $12.55 billion closed-end trust was trading at a 35.18% discount, according to the latest data. GBTC discount versus spot BTC/USD price. Source: YCharts To investors, GBTC has long served as a great alternative to gain exposure in the Bitcoin market despite its 2% annual management fee. This is primarily because GBTC is easier to hold for institutional investors because it can be managed via a brokerage account. For most of its existence, GBTC traded at a hefty premium to spot Bitcoin prices. But It starte...
Goldman Sachs’ bearish macro outlook puts Bitcoin at risk of crashing to $12K
A sequence of macro warnings coming out of the Goldman Sachs camp puts Bitcoin (BTC) at a risk of crashing to $12,000. Bitcoin in “bottom phase?” A team of Goldman Sachs economists led by Jan Hatzius raised their prediction for the speed of Federal Reserve benchmark rate hikes. They noted that the U.S. central bank would increase rates by 0.75% in September and 0.5% in November, up from their previous forecast of 0.5% and 0.25%, respectively. Fed’s rate-hike path has played a key role in determining Bitcoin’s price trends in 2022. The period of higher lending rates — from near zero to the 2.25-2.5% range now — has prompted investors to rotate out of riskier assets and seek shelter in safer alternatives like cash. Bitcoin has dropped by almost 60% year-to-date and is...
The floppening? Ethereum price weakens post-Merge, risking 55% drop against Bitcoin
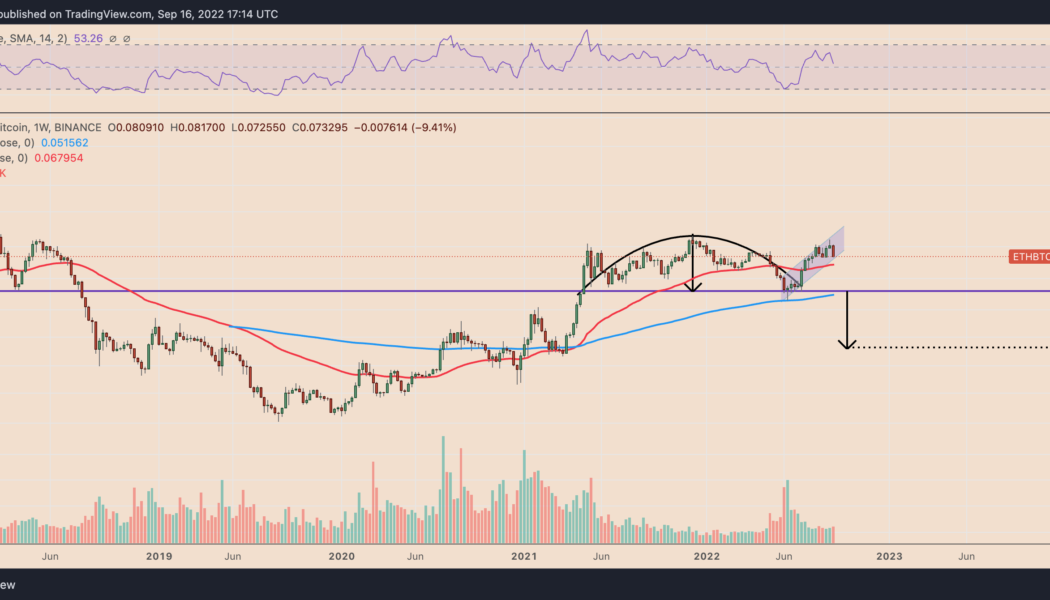
Ethereum’s native token Ether (ETH) has been forming an inverse-cup-and-handle pattern since May 2021 on the weekly chart, which hints at a potential decline against Bitcoin (BTC). ETH/BTC weekly price chart featuring inverse cup-and-handle breakdown setup. Source: TradingView An inverse cup-and-handle is a bearish reversal pattern, accompanied by lower trading volume. It typically resolves after the price breaks below its support level, followed by a fall toward the level at a length equal to the maximum height between the cup’s peak and the support line. Applying the theoretical definition on ETH/BTC’s weekly chart presents 0.03 BTC as its next downside target, down around 55% from Sept. 16’s price. Can ETH/BTC pull a Dow Jones? Alternatively, the ...
Elon Musk, Cathie Wood sound ‘deflation’ alarm — Is Bitcoin at risk of falling below $14K?
Bitcoin (BTC) has rebounded by 20% to almost $22,500 since Sept. 7. But bull trap risks abound in the long run as Elon Musk and Cathie Wood sound an alarm over a potential deflation crisis. Cathie Wood: “Deflation in the pipeline” The Tesla CEO tweeted over the weekend that a major Federal Reserve interest rate hike could increase the possibility of deflation. In other words, Musk suggests that the demand for goods and services will fall in the United States against rising unemployment. A major Fed rate hike risks deflation — Elon Musk (@elonmusk) September 9, 2022 Typically, rate hikes have been bad for Bitcoin this year. In context, the period of the Fed raising its benchmark rates from near zero in March 2022 to 2.25%–2.50% in August 2022 has coincided wi...
Why September is shaping up to be a potentially ugly month for Bitcoin price
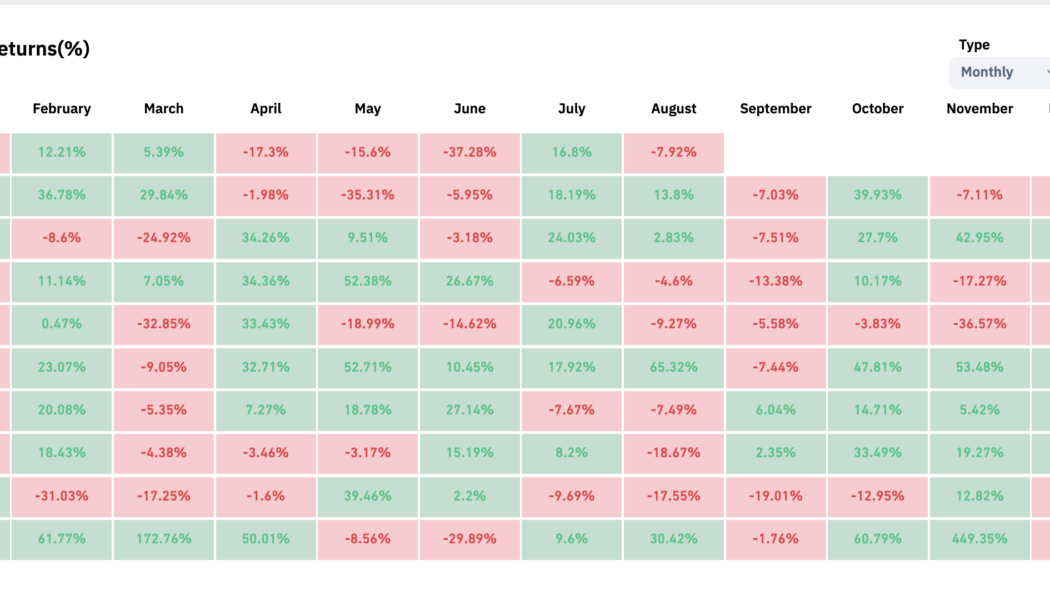
Bitcoin (BTC) bulls should not get excited about the recovery from the June lows of $17,500 just yet as BTC heads into its riskiest month in the coming days. The psychology behind the “September effect” Historic data shows September being Bitcoin’s worst month between 2013 and 2021, except in 2015 and 2016. At the same time, the average Bitcoin price decline in the month is a modest -6%. Bitcoin monthly returns. Source: CoinGlass Interestingly, Bitcoin’s poor track record across the previous September months coincides with similar downturns in the stock market. For instance, the average decline of the U.S. benchmark S&P 500 in September is 0.7% in the last 25 years. S&P 500 performance in August and September since 1998. Source: Bloomberg Traditional chart a...
Ethereum price rises by 50% against Bitcoin in one month — but there’s a catch
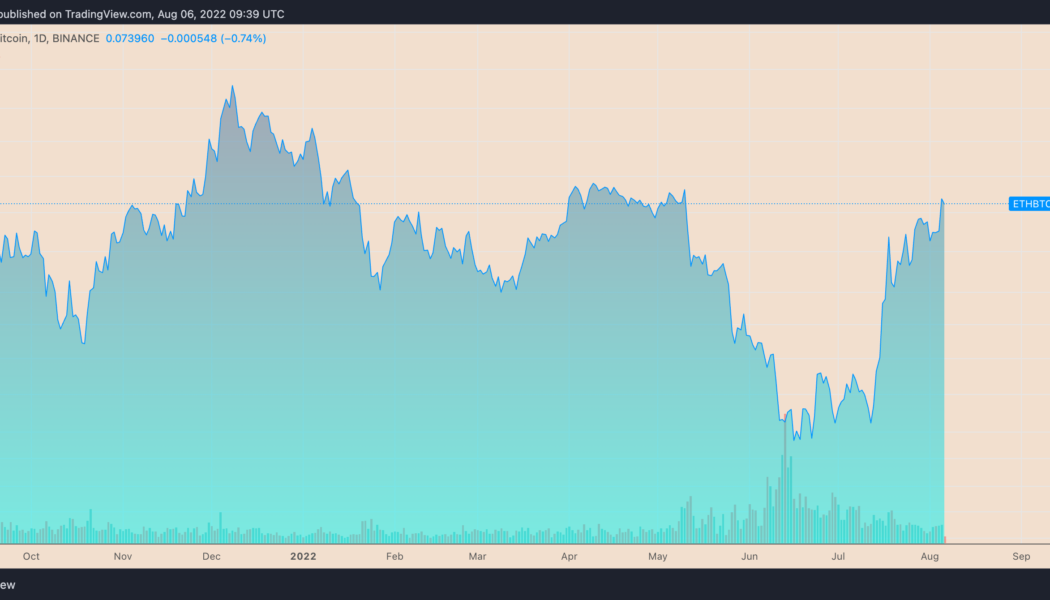
Ether (ETH), Ethereum’s native toke, has been continuing its uptrend against Bitcoin (BTC) as euphoria around its upcoming network upgrade, “the Merge,” grows. ETH at multi-month highs against BTC On the daily chart, ETH/BTC surged to an intraday high of 0.075 on Aug. 6, following a 1.5% upside move. Meanwhile, the pair’s gains came as a part of a broader rebound trend that started a month ago at 0.049, amounting to approximately 50% gains. ETH/BTC daily price chart. Source: TradingView The ETH/BTC recovery in part has surfaced due to the Merge, which will have Ethereum switch from proof-of-work (PoW) mining to proof-of-stake (PoS). Ethereum’s “rising wedge” suggests sell-off From a technical perspective, Ether stares at potential interim loss...
MicroStrategy stock MSTR hits 3-month high after CEO’s exit
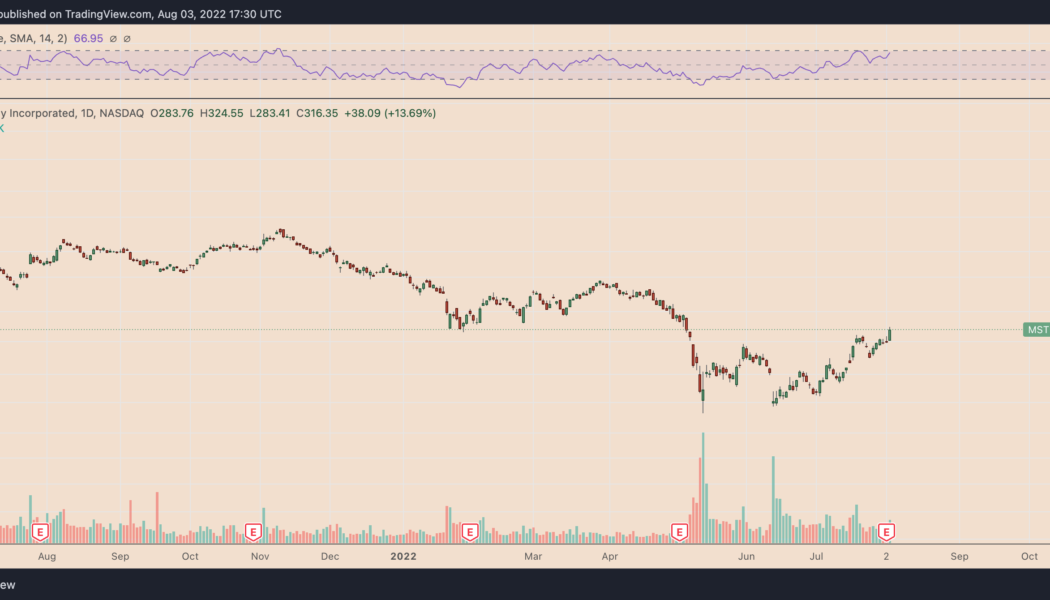
MicroStrategy (MSTR) stock opened higher on Aug. 3 as investors digested the news of its CEO Michael Saylor’s exit after a depressive quarterly earnings report. Microstrategy stock up 142% since May lows On the daily chart, MSTR’s price surged by nearly 14.5% to $324.55 per share, the highest level since May 6. The stock’s intraday gains came as a part of a broader recovery that started on May 12 at $134. Since then, MSTR has grown by 142% versus Nasdaq’s 26.81% gains in the same period. MSTR daily price chart. Source: TradingView Bad Q2, Saylor’s resignation The Aug. 3 MSTR rally came a day after MicroStrategy reported a billion dollar loss in its second quarter (Q2) earnings call. Interestingly, the company’s major Bitcoin exposure was a large re...
3 Bitcoin trading behaviors hint that BTC’s rebound to $24K is a ‘fakeout’
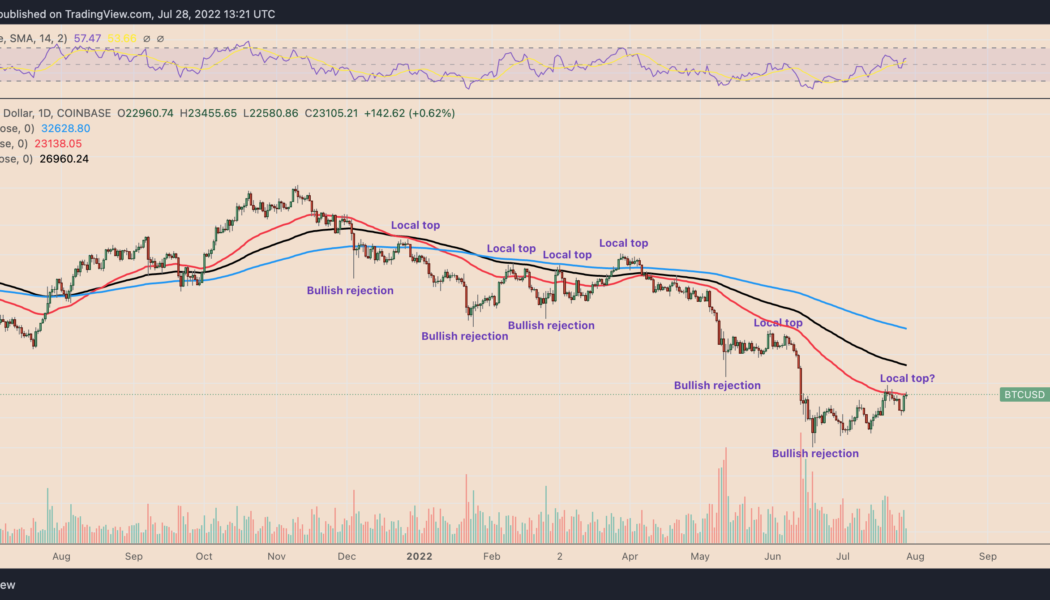
Bitcoin (BTC) price rallied toward $24,200 on July 28 after a near 10.5% surge that began a day earlier. The gains appeared after Federal Reserve Chairman Jerome Powell signaled intentions to slow down their prevailing tightening spree. They prompted some Bitcoin analysts to predict short-term upside continuation, with CryptoHamster seeing BTC at $26,000 next. It seems that the downside breakout was a false one, and the bullish flag has been validated. Let’s see how fast $BTC can reach those targets. #bitcoin $BTCUSD $ETH $ETHUSD #ビットコイン #биткойн #比特币 https://t.co/v6x4Ka23L7 pic.twitter.com/nKoEV8440X — CryptoHamster (@CryptoHamsterIO) July 28, 2022 But BTC’s potential to recover entirely from its ongoing bearish slumber appears low for at least three key reasons. Bitcoin bulls...
3 signs Bitcoin price is forming a potential ‘macro bottom’
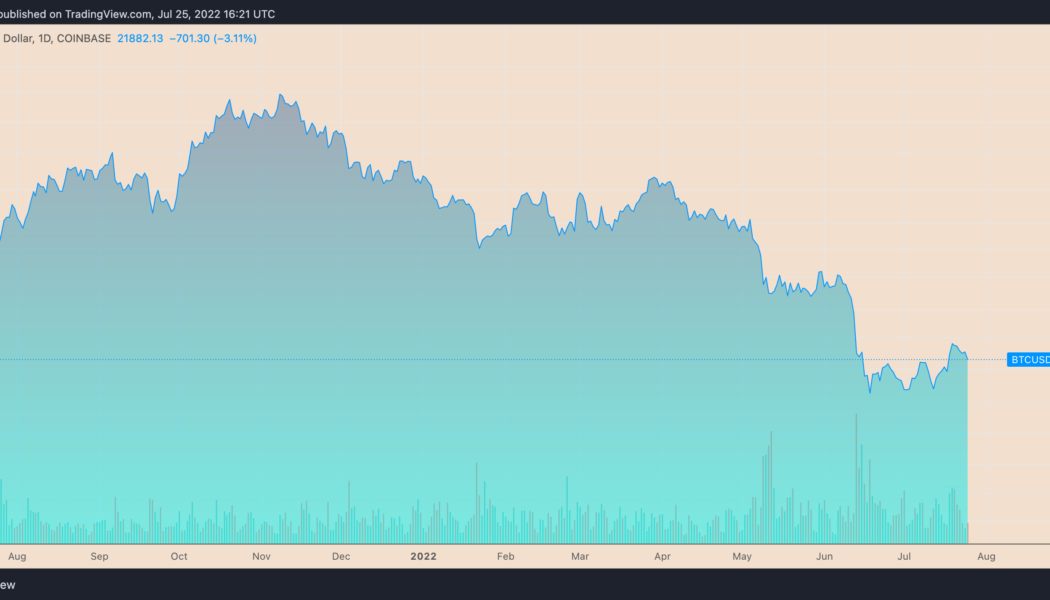
Bitcoin (BTC) could be in the process of bottoming after gaining 25%, based on several market signals. BTC’s price has rallied roughly 25% after dropping to around $17,500 on June 18. The upside retrace came after a 75% correction when measured from its November 2021 high of $69,000. BTC/USD daily price chart. Source: TradingView The recovery seems modest, however, and carries bearish continuation risks due to prevailing macroeconomic headwinds (rate hike, inflation, etc.) and the collapse of many high-profile crypto firms such as Three Arrows Capital, Terra and others. But some widely tracked indicators paint a different scenario, suggesting that Bitcoin’s downside prospects from current price levels are minimal. That big “oversold” bounce The...
Bitcoin price indicator that marked 2015 and 2018 bottoms is flashing
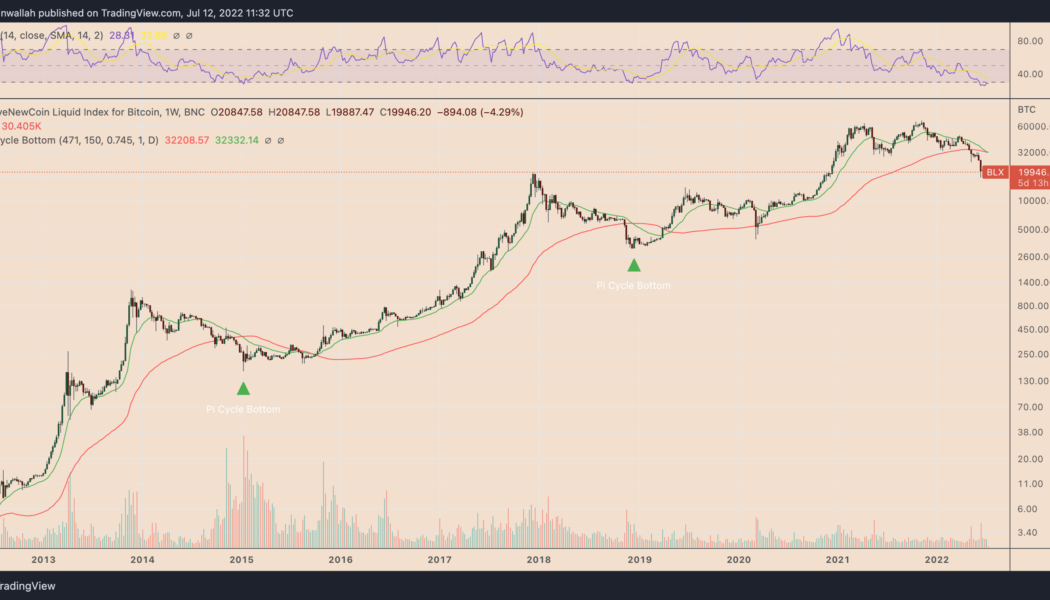
Bitcoin (BTC) could undergo a massive price recovery in the coming months, based on an indicator that marked the 2015 and 2018 bear market bottoms. What’s the Bitcoin Pi Cycle bottom indicator? Dubbed “Pi Cycle bottom,” the indicator comprises a 471-day simple moving average (SMA) and a 150-period exponential moving average (EMA). Furthermore, the 471-day SMA is multiplied by 0.745; the outcome is pitted against the 150-day EMA to predict the underlying market’s bottom. Notably, each time the 150-period EMA has fallen below the 471-period SMA, it has marked the end of a Bitcoin bear market. For instance, in 2015, the crossover coincided with Bitcoin bottoming out near $160 in January 2015, followed by an almost 12,000% bull run toward $20,000 in December 2017....
- 1
- 2
