BTC price
Bitcoin price cracks $21K as trader says BTC buy now ‘very compelling’
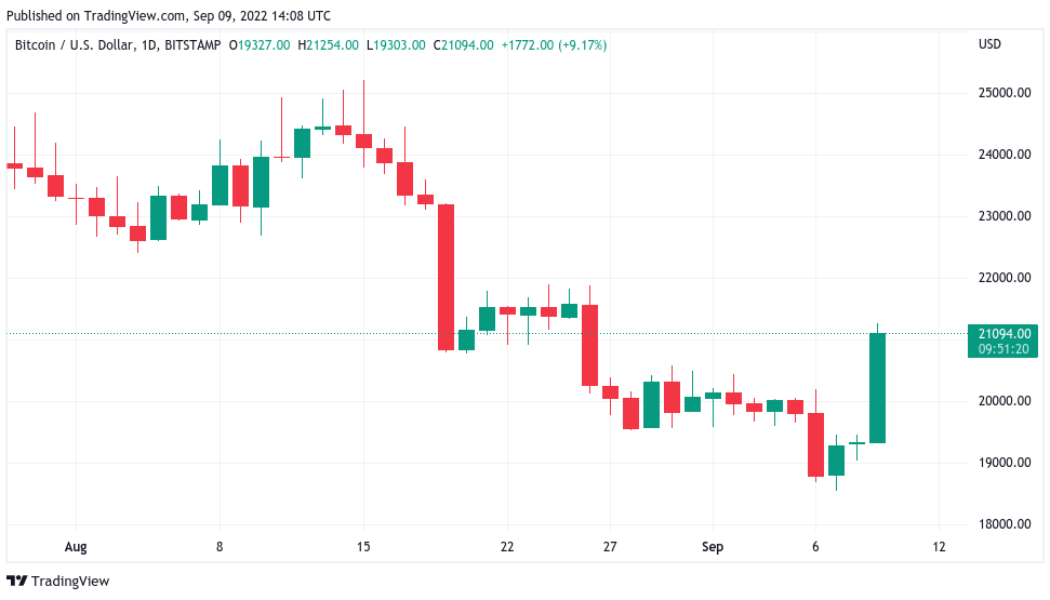
Bitcoin (BTC) circled $21,000 at the Sep. 9 Wall Street open as newly-won gains endured. Meanwhile, the total cryptocurrency market capitalization has crossed back above the $1 billion mark. BTC/USD 1-day candle chart (Bitstamp). Source: TradingView BTC price gives “confirmation” of trend change Data from Cointelegraph Markets Pro and TradingView followed BTC/USD as its “short squeeze” punished late bears. After a brief consolidation, the pair set new multi-week highs of $21,254 on Bitstamp, and now faced resistance in the form of an old support level abandoned in late August. For market commentators, however, the latest move had already proved decisive — and should favor bulls beyond short timeframes. “This impulse up is THE confirmation,” popular Twitter trader and ange...
BTC price nears $21.7K as whales boost Bitcoin ‘almost perfectly’
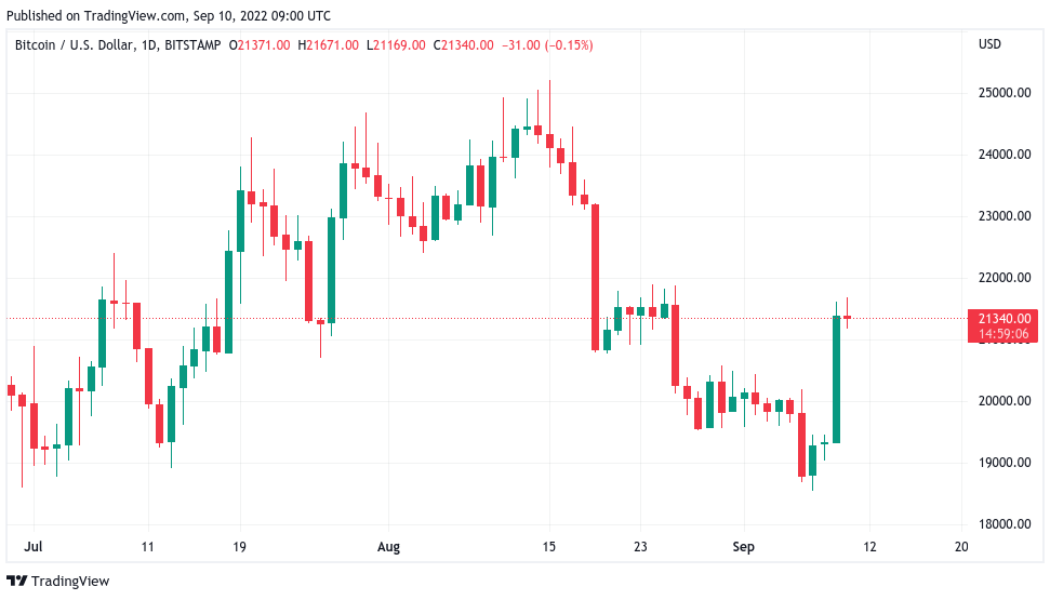
Bitcoin (BTC) sought to overturn August resistance on Sep. 10 as whale buy-levels dictated BTC price action. BTC/USD 1-day candle chart (Bitstamp). Source: TradingView Whales provide short-term price ceiling Data from Cointelegraph Markets Pro and TradingView showed BTC/USD hitting new multi-week highs of $21,671 on Bitstamp. The pair capitalized on a short squeeze which began early on Sep. 9, taking it around 10% higher after plumbing the lowest levels since the end of June. Analyzing the events, on-chain monitoring resource Whalemap noted that clusters of buy-ins by whales had effectively allowed Bitcoin to put in a floor. $19,000 had been a high-volume zone of interest for buyers previously, and this thus remained unviolated during the visit to two-month lows. As Cointelegraph reported,...
Bitcoin price hits 10-week low amid ‘painful’ US dollar rally warning
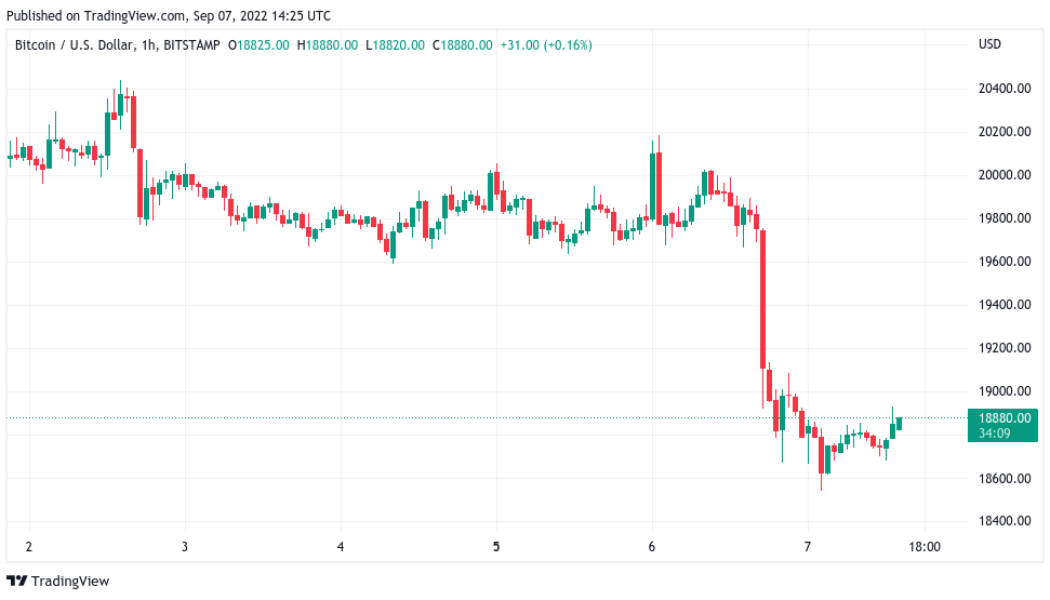
Bitcoin (BTC) provided a long awaited breakout into Sept. 7 as BTC price action dashed bulls’ hopes of a recovery. BTC/USD 1-hour candle chart (Bitstamp). Source: TradingView $23,000 relief bounce “still likely” says trader Data from Cointelegraph Markets Pro and TradingView captured snap losses for BTC/USD later on Sept. 6, with overnight lows coming in at $18,540 on Bitstamp. The pair put in its lowest levels since June 30, taking liquidity from the July floor and only marginally recovering on the day. BTC/USD 1-day candle chart (Bitstamp). Source: TradingView Downside price action followed almost a week of sideways movements and volatility was nowhere to be seen as market participants gritted their teeth hoping for an exit to the upside. In the event, they were left disappoi...
Traders say Bitcoin price bounce is overdue after a ‘massive’ BTC long position appears
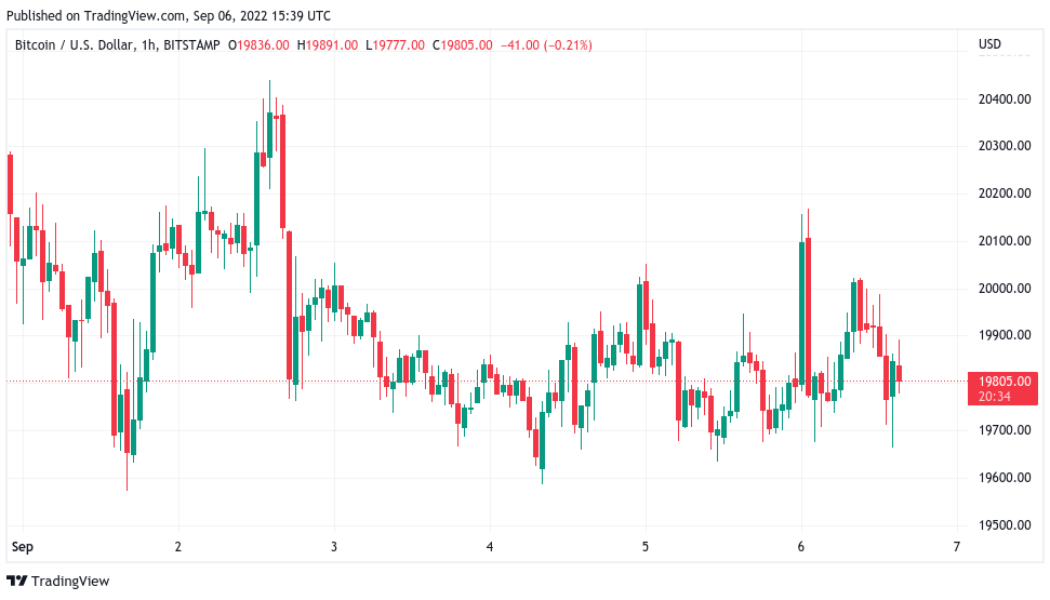
Bitcoin (BTC) traded in an increasingly narrow range on Sept. 6 as bets piled in over an imminent breakout. BTC/USD 1-hour candle chart (Bitstamp). Source: TradingView Binance futures giant sucks in spent BTC Data from Cointelegraph Markets Pro and TradingView showed BTC/USD staying under $20,000 for a fourth straight day with bulls failing to crack resistance. As many wondered when and how the latest consolidation phase would end, two popular social media traders noticed an ongoing accumulation trend by an unknown large-scale Binance futures trading entity. With retail investors selling, that entity had spent several days soaking up the liquidity, and the result was likely obvious. “Bounce incoming,” Il Capo of Crypto predicted in part of an update on the phenomenon, describing the entity...
Bitcoin market dominance plumbs 4-year lows as BTC price ditches $20K
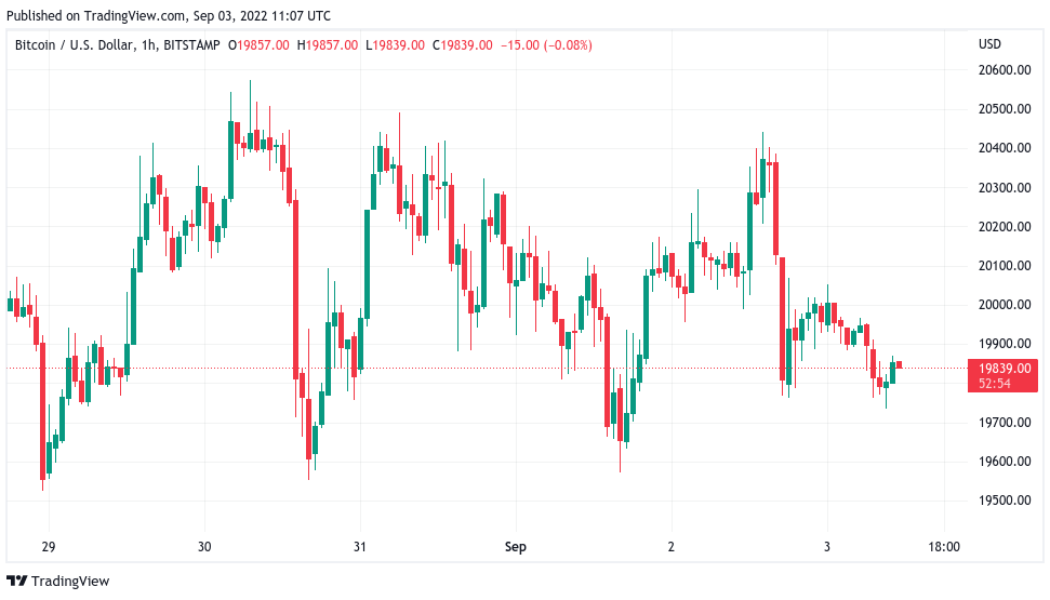
Bitcoin (BTC) traded below $20,000 on Sep. 3 as commodities declined on news of a G7 Russian energy ban. BTC/USD 1-hour candle chart (Bitstamp). Source: TradingView All down after gloomy macro week Data from Cointelegraph Markets Pro and TradingView showed ongoing lackluster performance on BTC/USD, which traded around $19,800. The largest cryptocurrency looked increasingly unable to flip $20,000 to firm support as the weekend began, and the mood among market participants was jaded. Eyeing the 8-day exponential moving average (EMA), popular trader Cheds noted its strength as intraday resistance continuing into September. $BTC if you are trading this and not watching daily EMA 8 you are literally asleep at the wheel. No excuses https://t.co/cTGEHWQNYo pic.twitter.com/WwMmwCLFO5 — Cheds (@Big...
Bitcoin hits new September high on US payrolls, G7 Russian energy cap
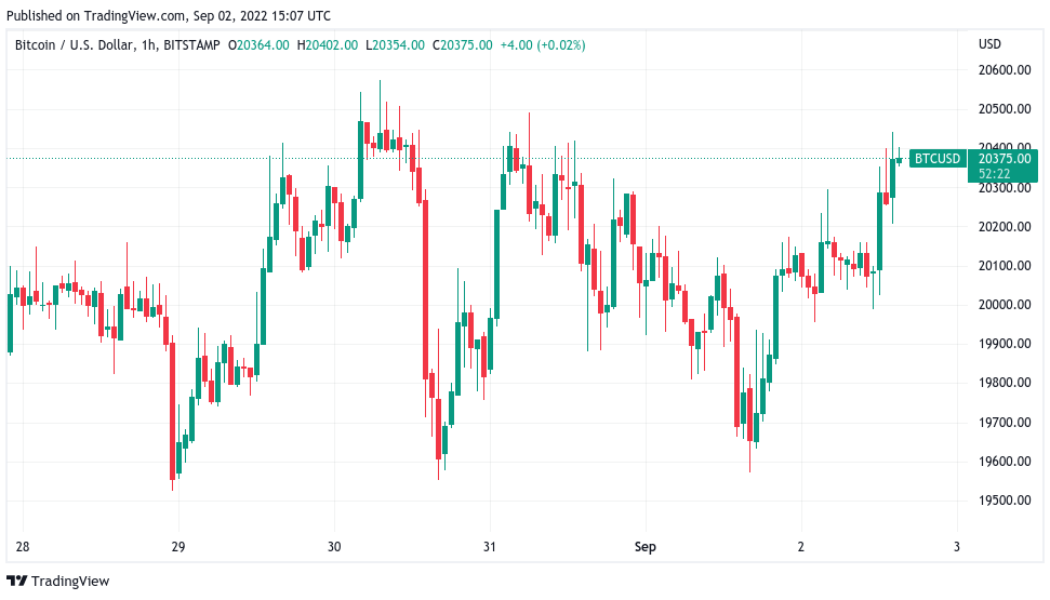
Bitcoin (BTC) passed $20,400 for the first time this month on Sept. 2 as United States economic data outperformed expectations. BTC/USD 1-hour candle chart (Bitstamp). Source: TradingView Declining dollar accompanies BTC price rebound Data from Cointelegraph Markets Pro and TradingView showed BTC/USD approaching $20,500 after the Wall Street open, marking new highs for September. The pair had responded well to U.S. non-farm payroll data, which in August showed inflows dropping less than expected. A further boost came from news that the G7 had agreed to implement a price cap on Russian oil, with the European Union also planning to target the country’s gas imports. While the S&P500 and Nasdaq Composite Index both added 1.25% after the first hour’s trading, the U.S. dollar conversely fell...
Bitcoin squeeze to $23K still open as crypto market cap holds key support
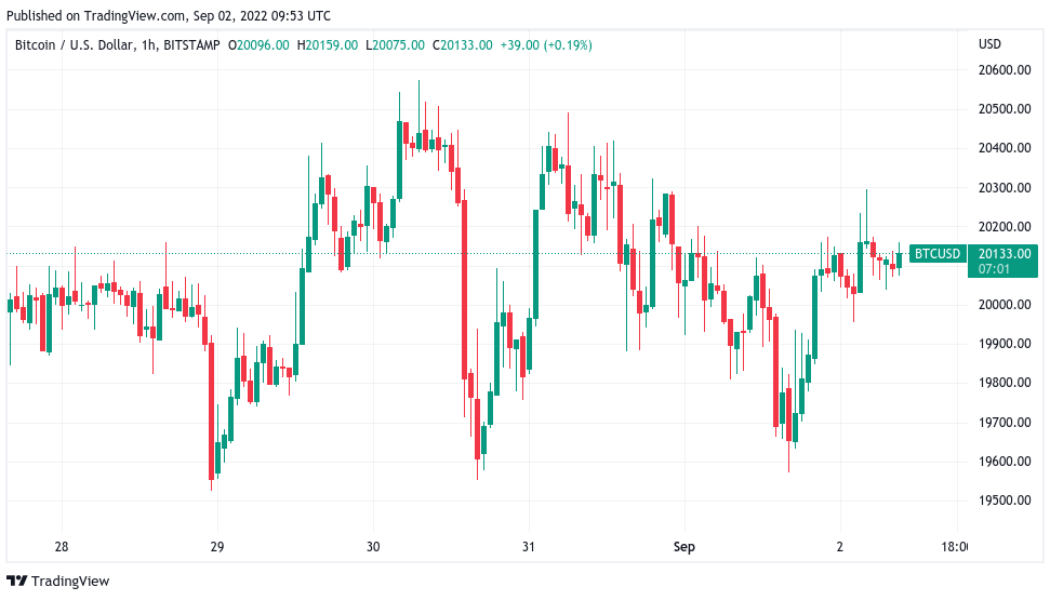
Bitcoin (BTC) returned to $20,000 on Sep. 2 amid renewed bets on a “short squeeze” higher. BTC/USD 1-hour candle chart (Bitstamp). Source: TradingView Trader eyes $20,700 short squeeze trigger Data from Cointelegraph Markets Pro and TradingView showed BTC/USD recovering from another dip below the $20,000 mark on the day, continuing rangebound behavior. The pair gave little insight into which direction the next breakout could be, with opinions differing on the surrounding environment. Amid downside pressure on risk assets and a strong U.S. dollar, overall consensus appeared to favor long-term weakness continuing. For popular trader Il Capo of Crypto, however, there was still reason to believe that a relief bounce could enter first. Thanks to the majority of the market expecting immediate lo...
US dollar smashes yet another 20-year high as Bitcoin price sags 2.7%
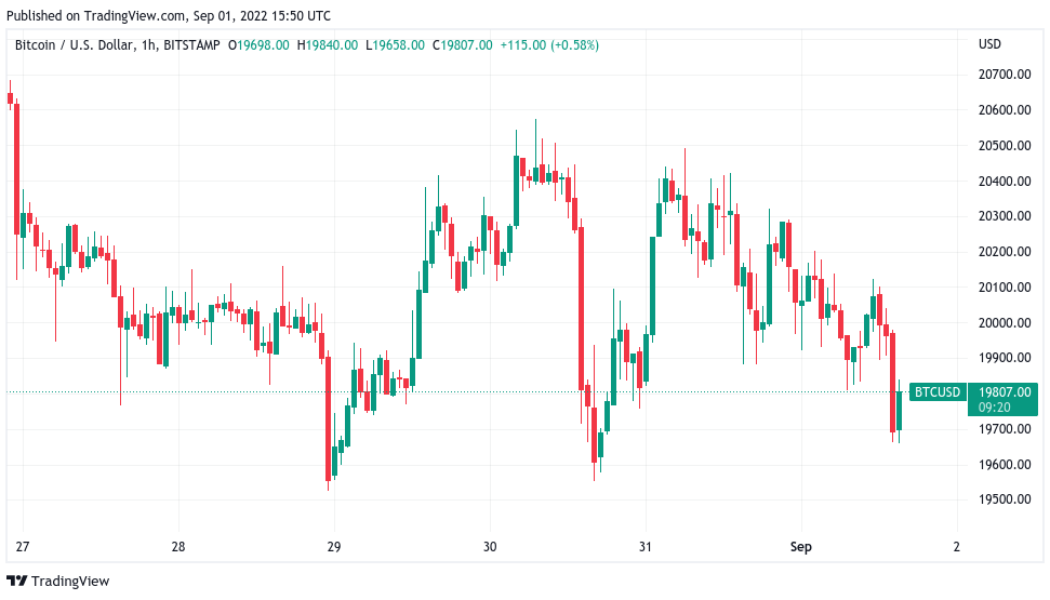
Bitcoin (BTC) faced familiar pressure on the Sept. 1 Wall Street open as the U.S. dollar hit fresh two-decade highs. BTC/USD 1-hour candle chart (Bitstamp). Source: TradingView Trader: DXY could hit 115 before ‘slowdown’ Data from Cointelegraph Markets Pro and TradingView followed BTC/USD as it fell to $19,658 on Bitstamp, down 2.7% from the day’s high. The pair faced stiff resistance trying to flip the important $20,000 mark to solid support, with macro cues further complicating the picture for bulls. That came in the form of a resurgent U.S. dollar index (DXY) on the day, which beat previous peaks to reach 109.97, its highest since September 2002. U.S. dollar index (DXY) 1-day candle chart. Source: TradingView Risk assets thus broadly lost ground, with the S&P 500 and Nas...
Bitcoin erases latest gains with BTC price back below $20K as dollar spikes
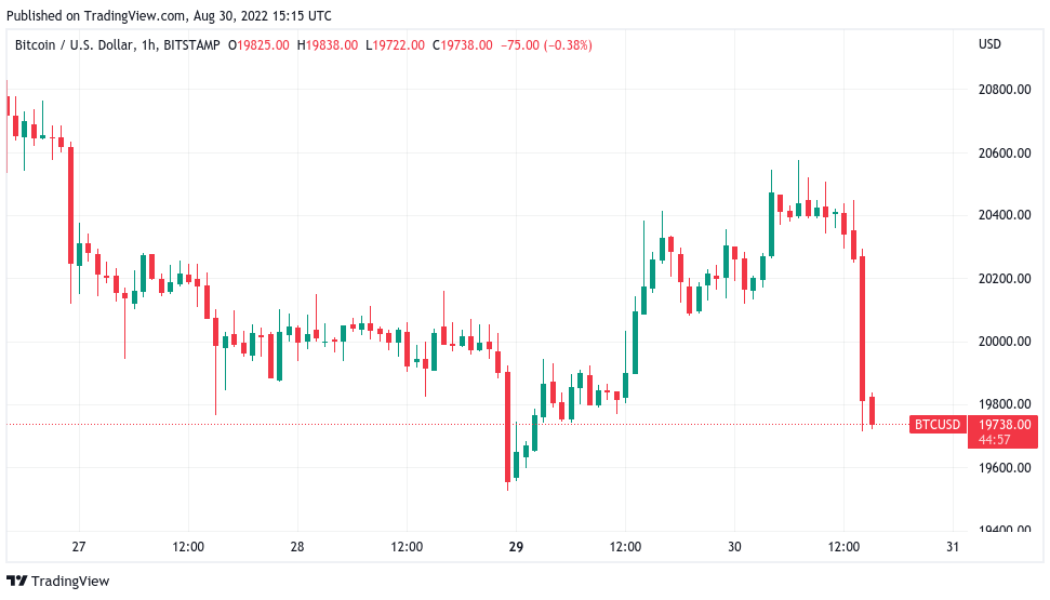
Bitcoin (BTC) fell back below $20,000 after the Aug. 30 Wall Street open as data showed hodlers selling at a loss. BTC/USD 1-hour candle chart (Bitstamp). Source: TradingView June lows look increasingly attractive Data from Cointelegraph Markets Pro and TradingView captured the latest dive below the 2017 bull market peak for BTC/USD, with United States equities dropping in step. The S&P 500 and Nasdaq Composite Index lost 1.1% and 1.25% in the first hour, respectively, while BTC/USD shed 2.5% during a single hourly candle. The latest moves came as no surprise to traders already wary of a deeper correction for the largest cryptocurrency. Previously, many had called for a retracement toward the macro lows seen in June. For popular trader Crypto Ed, both Bitcoin and Ether (ETH) offered go...
Bitcoin threatens 20-month low monthly close with BTC price under $20K
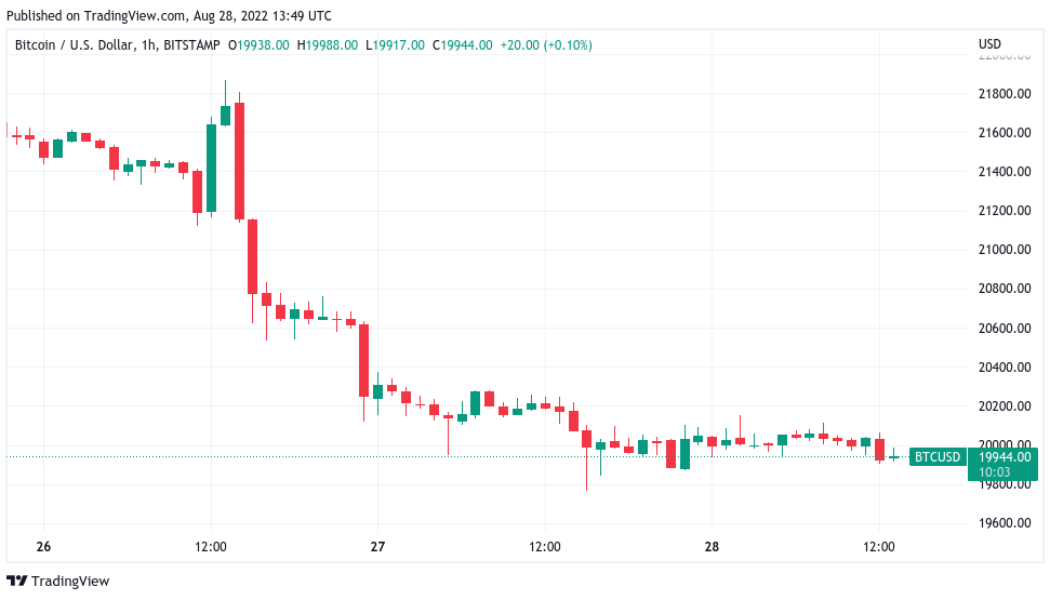
Bitcoin (BTC) looked set to equal its lowest monthly close since 2020 on Aug. 28 as bulls failed to take control. BTC/USD 1-hour candle chart (Bitstamp). Source: TradingView Odds stack up for a deeper dive below $20,00 Data from Cointelegraph Markets Pro and TradingView showed BTC/USD criss-crossing $20,000 with hours until the weekly candle completed. The pair had been unable to make up for lost ground over the weekend, and just days from the end of the month, even $20,000 appeared vulnerable as support. At the time of writing, Bitcoin traded near $19,900 — below June’s closing price. BTC/USD 1-month candle chart (Bitstamp). Source: TradingView “It didn’t matter what kind of lines or squiggles you had on your charts,” on-chain monitoring resource Material Indicators summarized over ...
Bitcoin risks worst August since 2015 as hodlers brace for ‘Septembear’
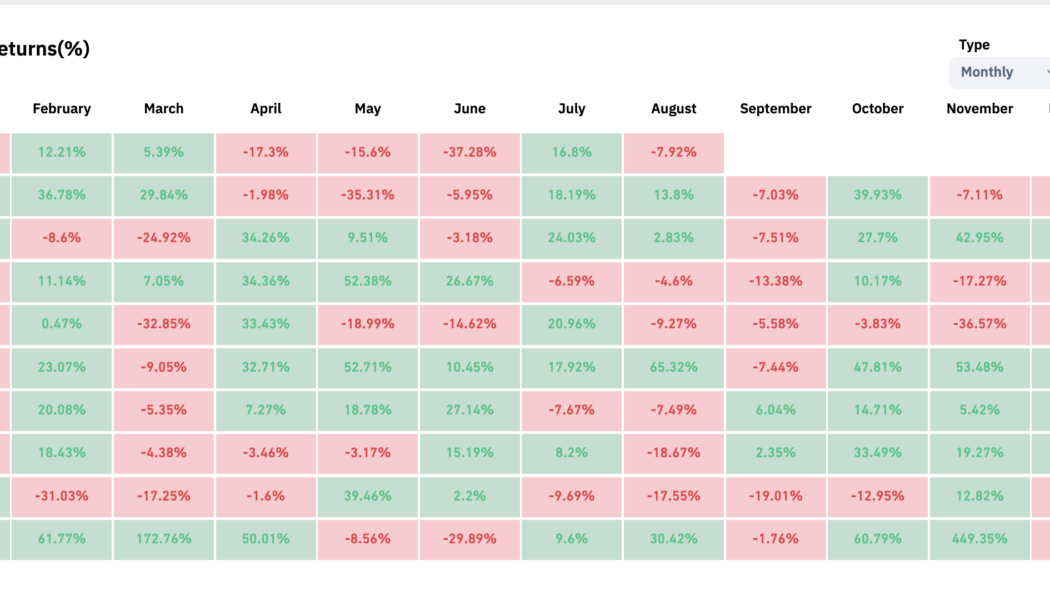
BItcoin (BTC) is on track to see its worst August performance since the 2015 bear market — and next month may be even worse. Data from on-chain analytics resource Coinglass shows that BTC/USD has not had an August this bad for seven years. September means average 5.9% BTC price losses After two major BTC price comedowns in recent weeks, Bitcoin hodlers are understandably fearful — but historically, September has delivered even worse performance than August. At $20,000, BTC/USD is down 14% this month, making this August the biggest loser since 2015, when the pair posted an 18.67% red monthly candle. Subsequent years have proven that August can be a mixed bag when it comes to BTC price performance — in 2017, for example, the largest cryptocurrency gained over 65% in a bullish record. One mon...
Why September is shaping up to be a potentially ugly month for Bitcoin price
Bitcoin (BTC) bulls should not get excited about the recovery from the June lows of $17,500 just yet as BTC heads into its riskiest month in the coming days. The psychology behind the “September effect” Historic data shows September being Bitcoin’s worst month between 2013 and 2021, except in 2015 and 2016. At the same time, the average Bitcoin price decline in the month is a modest -6%. Bitcoin monthly returns. Source: CoinGlass Interestingly, Bitcoin’s poor track record across the previous September months coincides with similar downturns in the stock market. For instance, the average decline of the U.S. benchmark S&P 500 in September is 0.7% in the last 25 years. S&P 500 performance in August and September since 1998. Source: Bloomberg Traditional chart a...
