BTC price
3 historically accurate Bitcoin on-chain metrics are flashing ‘bottom’
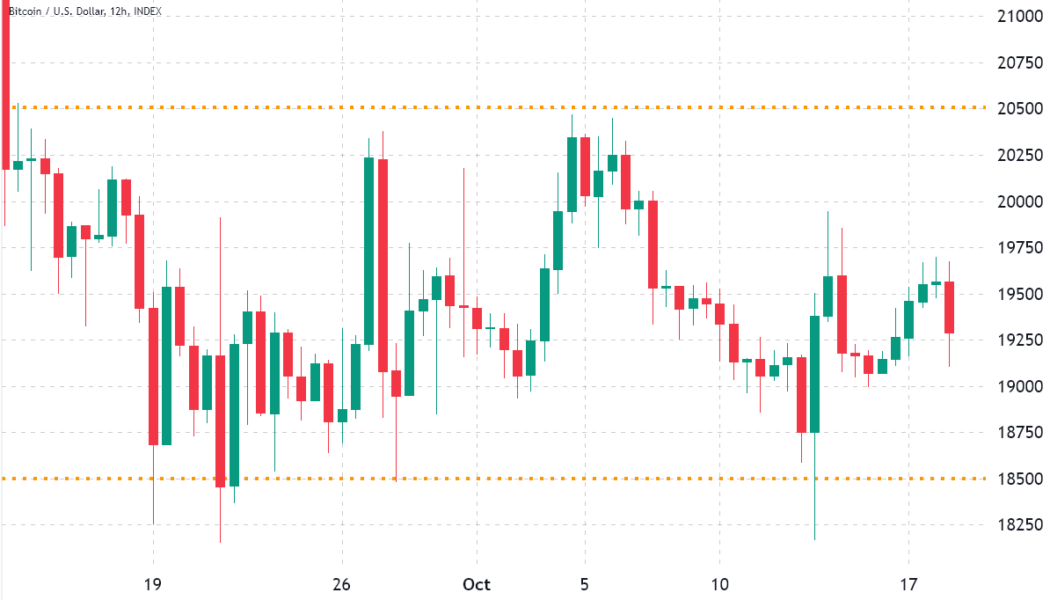
Bitcoin (BTC) and other riskier assets slipped on Oct. 21 as traders scrutinized macro indicators that suggest the Federal Reserve would continue to hike rates. Nonetheless, the BTC/USD pair remains rangebound inside the $18,000–$20,000 price range, showing a strong bias conflict in the market. BTC price holding above $18K since June Notably, BTC’s price has been unable to dive deeper below $18,000 since it first tested the support level in June 2022. As a result, some analysts believe that the cryptocurrency is bottoming out, given it has already corrected by over 70% from its record high of $69,000, established almost a year ago. BTC/USD daily price chart. Source: TradingView “During the 2018 bear market, BTC saw a max drawdown from peak to trough of 84%, lasting 364 days, wh...
Here’s what could spark a ‘huge BTC rally’ as Bitcoin clings to $19K
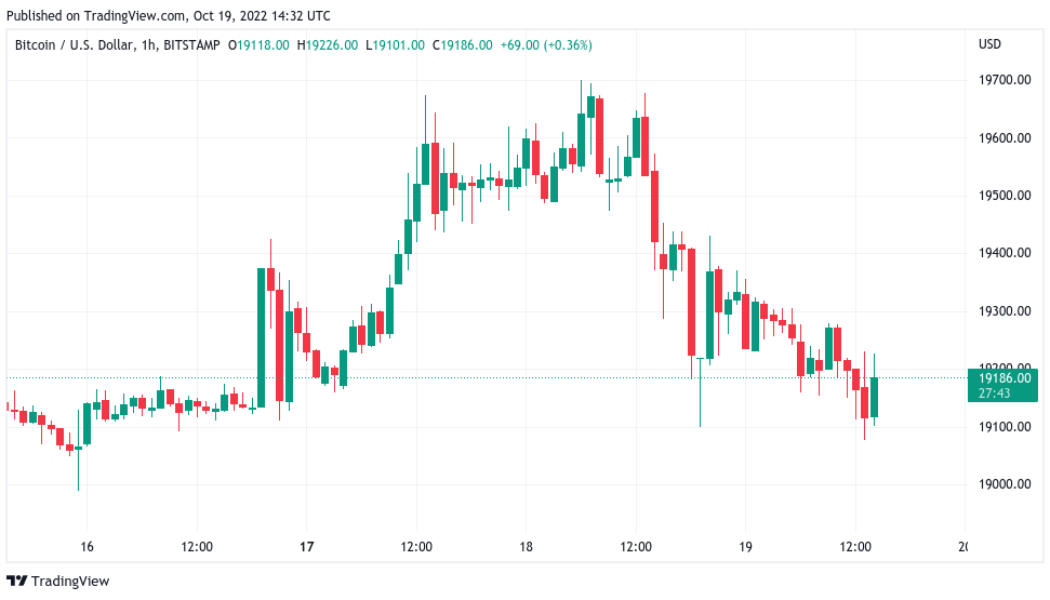
Bitcoin (BTC) sagged with United States equities at the Oct. 19 Wall Street open as markets awaited tech earnings. BTC/USD 1-hour candle chart (Bitstamp). Source: TradingView Eurozone sees fresh all-time high inflation Data from Cointelegraph Markets Pro and TradingView showed BTC/USD circling $19,000 after falling steadily overnight. Still trapped in a tight range, the pair offered few cues to traders seeking advantageous short-term plays, while some sources argued that overall, current levels represented solid buy levels. “With little calendar events till the next FOMC in early November, crypto continuing to lag behind equities, and skews near flat, protective downside structures are the cheapest levels they have been since June,” trading firm QCP Capital concluded to Telegram channel su...
‘Get ready’ for BTC volatility — 5 things to know in Bitcoin this week
Bitcoin (BTC) starts a new week keeping everyone guessing as a tiny trading range stays in play. A non-volatile weekend continues a familiar status quo for BTC/USD, which remains just above $19,000. Despite calls for a rally and a run to lower macro lows next, the pair has yet to make a decision on a trajectory — or even signal that a breakout or breakdown is imminent. After a brief spell of excitement seen on the back of last week’s United States economic data, Bitcoin is thus back at square one — literally, as price action is now exactly where it was at the same time last week. As the market wonders what it might take to crack the range, Cointelegraph takes a look at potential catalysts in store this week. Spot price action has traders dreaming of breakout For Bitcoin traders, it is a ca...
Bitcoin clings to $19K as trader promises capitulation ‘will happen‘
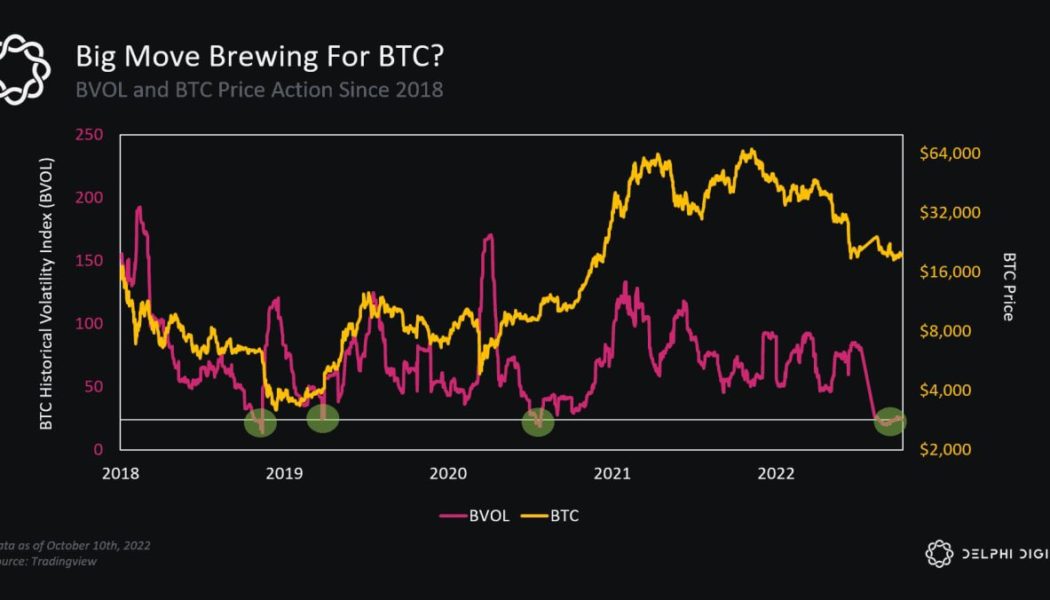
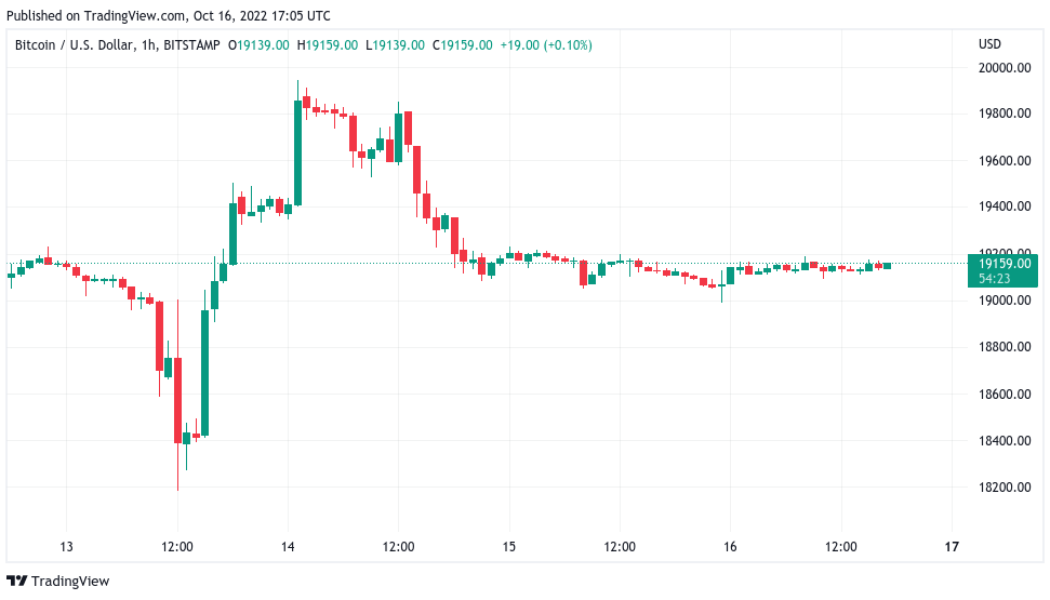
Bitcoin (BTC) stayed rigidly tied to $19,000 into the Oct. 16 weekly close as analysts warned that volatility was long overdue. BTC/USD 1-hour candle chart (Bitstamp). Source: TradingView Analyst: BTC volatility a “matter of time” Data from Cointelegraph Markets Pro and TradingView captured a lackluster weekend for BTC/USD as the pair barely moved in out-of-hours trading. After United States economic data sparked a series of characteristic fakeout events over the week, Bitcoin returned to its original position, and at the time of writing showed no signs of leaving its established range. For Michaël van de Poppe, founder and CEO of trading platform Eight, it was a question of not if, but when unpredictability would return to crypto. “Matter of time until massive volatility is going to...
Bitcoin trader predicts $18K return within days as stocks wilt post-CPI
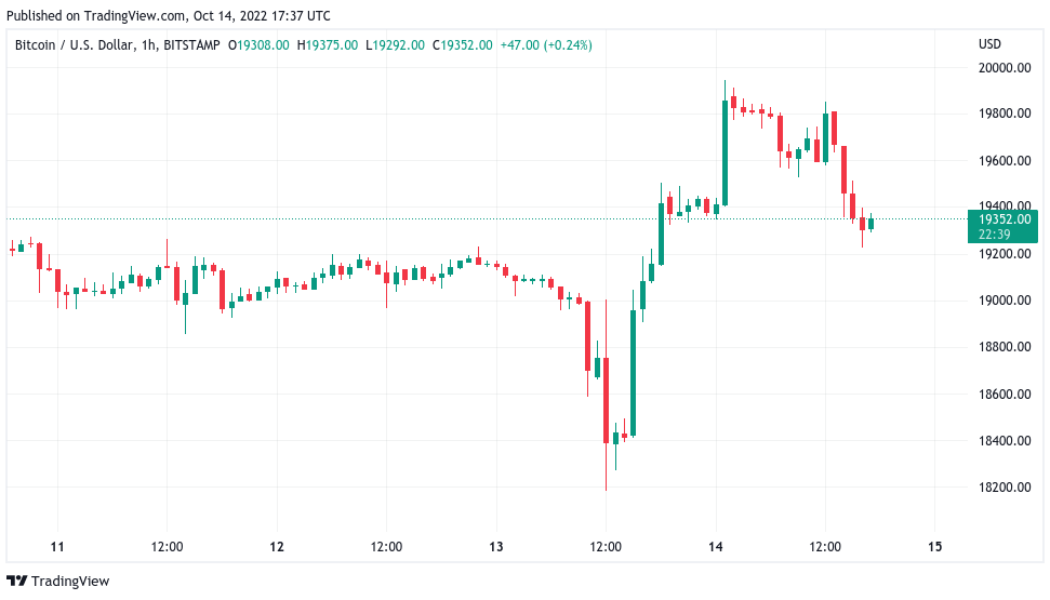
Bitcoin (BTC) cooled near $19,200 after the Oct. 14 Wall Street open as stocks struggled to preserve their “bear trap.” BTC/USD 1-hour candle chart (Bitstamp). Source: TradingView Analyst: “Abandon all hope” for asset price rebound Data from Cointelegraph Markets Pro and TradingView followed BTC/USD as it came off one-week highs on the day to circle $19,300. The pair had seen intense volatility on the back of United States economic data the day prior, this sparking hundreds of millions of dollars in liquidations from both long and short positions. Now, after turning the tables and adding almost $2,000 in 24 hours, Bitcoin was again losing momentum as U.S. equities turned red on the day. At the time of writing, the S&P 500 was down 1.9%, while the Nasdaq Composite Index trad...
‘No emotion’ — Bitcoin metric gives $35K as next BTC price macro low
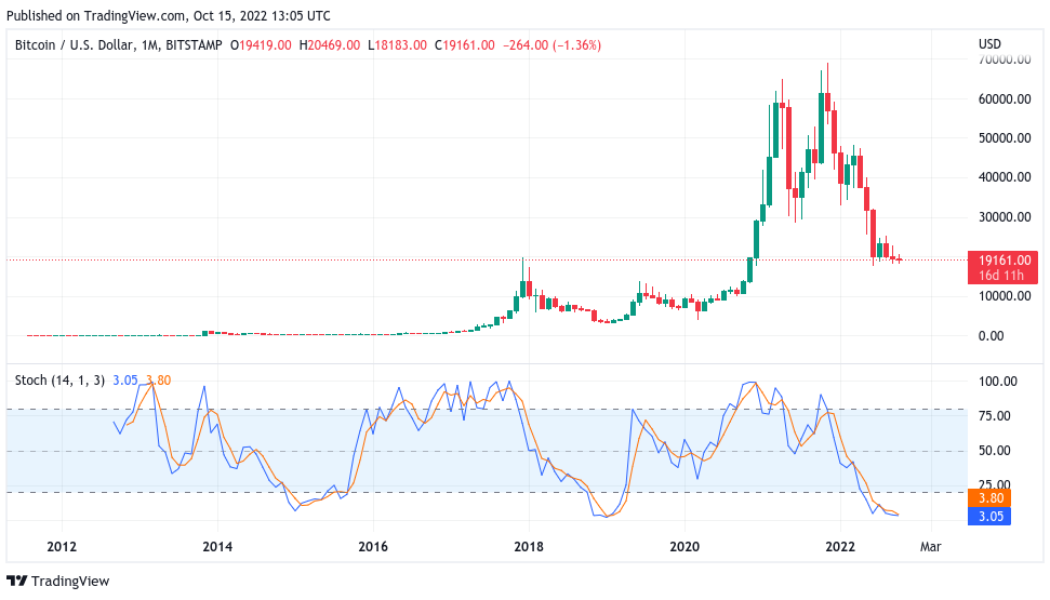
Bitcoin (BTC) is showing textbook macro bottom signs in a “business as usual” bear market, data suggests. In fresh findings published on Oct. 13, popular Twitter trader Alan revealed that BTC price action is closely mimicking prior cycles. Trader on Stoch data: “Don’t be shaken out” While some are concerned about the current state of Bitcoin and crypto markets, on-chain indicators have long suggested that the 2022 bear market is comfortingly similar to previous ones. Eyeing the one-month stochastic chart for BTC/USD, Alan highlighted Bitcoin repeating a structure common to both the 2014 and 2018 bear markets. Stochastic oscillators are classic tools for identifying price cycles and bullish and bearish interplay. Bitcoin has proved to be no exception, with monthly low Stoc...
Bitcoin bear market will last ‘2-3 months max’ —Interview with BTC analyst Philip Swift
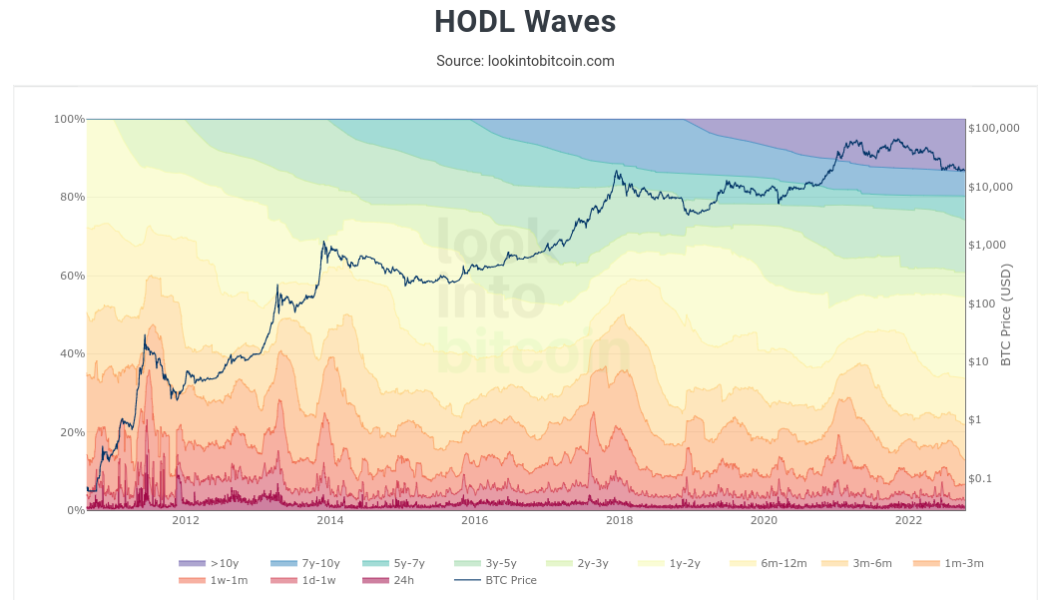
Bitcoin (BTC) may see more pain in the near future, but the bulk of the bear market is already “likely” behind it. That is one of many conclusions from Philip Swift, the popular on-chain analyst whose data resource, LookIntoBitcoin, tracks many of the best-known Bitcoin market indicators. Swift, who together with analyst Filbfilb is also a co-founder of trading suite Decentrader, believes that despite current price pressure, there is not long to go until Bitcoin exits its latest macro downtrend. In a fresh interview with Cointelegraph, Swift revealed insights into what the data is telling analysts — and what traders should pay attention to as a result. How long will the average hodler need to wait until the tide turns and Bitcoin comes storming back from two-year lows? Cointelegraph (CT): ...
Bitcoin ‘bear trap’ sees BTC price near $20K as daily gains top 9%
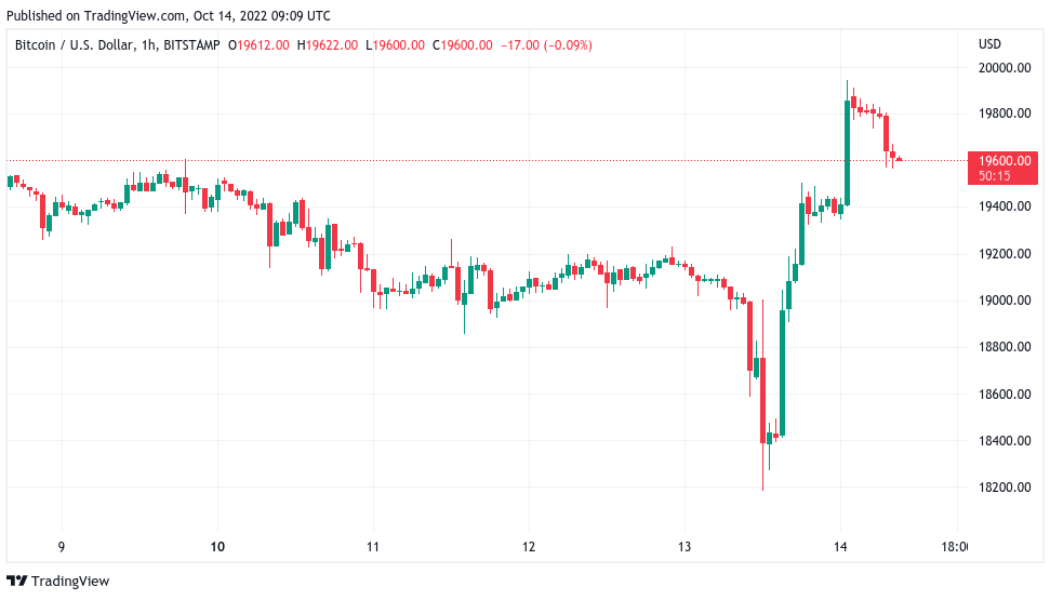
Bitcoin (BTC) delivered more surprises into Oct. 14 as the reaction to macro triggers saw a sudden run at $20,000. BTC/USD 1-hour candle chart (Bitstamp). Source: TradingView Stocks, crypto smoke shorts Data from Cointelegraph Markets Pro and TradingView showed BTC/USD climbing to one-week highs, gaining almost $2,000 in hours. After the United States Consumer Price Index (CPI) print for September came in above expectations, an initial crypto rout put bulls on edge, but the pain was short lived. Bitcoin ultimately ran higher than its pre-CPI levels, following stocks which were described as delivering the “biggest bear trap of 2022.” “That’s gotta be the biggest bear trap I’ve seen so far,” popular Twitter trading account Stockrocker reacted. “Even I was starti...
‘Violent’ Bitcoin breakout due as BTC open interest nears all-time high
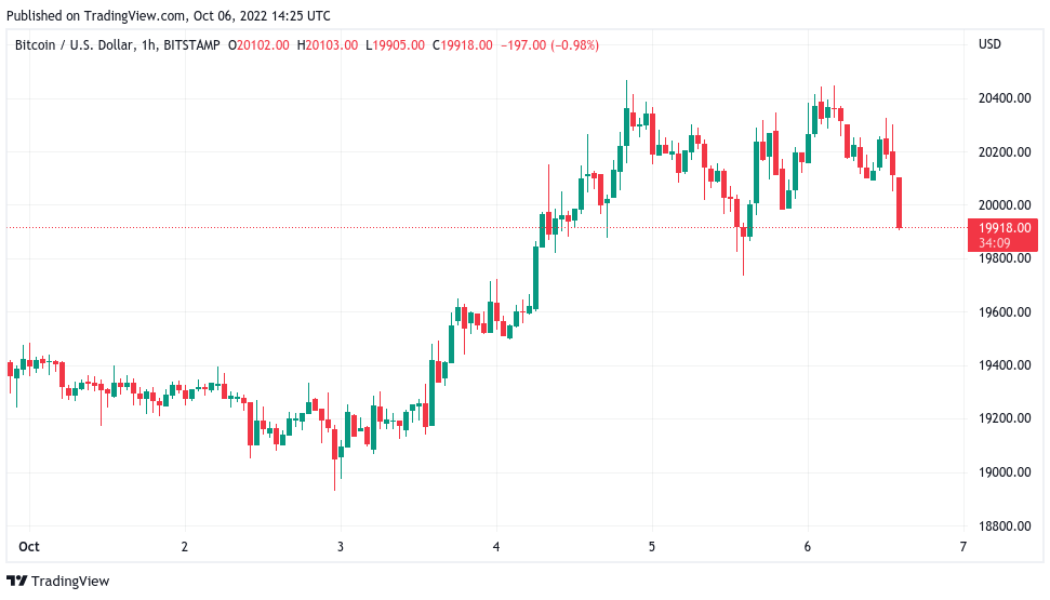
Bitcoin (BTC) stayed rangebound at the Oct. 6 Wall Street open with traders already planning for a “violent” breakout. BTC/USD 1-hour candle chart (Bitstamp). Source: TradingView Bitcoin whale activity highlights the importance of $19,000 Data from Cointelegraph Markets Pro and TradingView followed BTC/USD as it moved up and down by only a matter of a few hundred dollars on the day. The amount of $20,000 formed a focus for the pair, which meandered in step with consolidating U.S. equities and dollar strength. With no spot catalyst in sight on short timeframes, on-chain analytics resource Whalemap turned to largescale buy and sell points to sketch out likely support and resistance. To the downside, $19,174 marked the site of whale buy-ins, suggesting its continued strength as a line in the ...
Bitcoin still has $14K target, warns trader as DXY due ‘parabola’ break
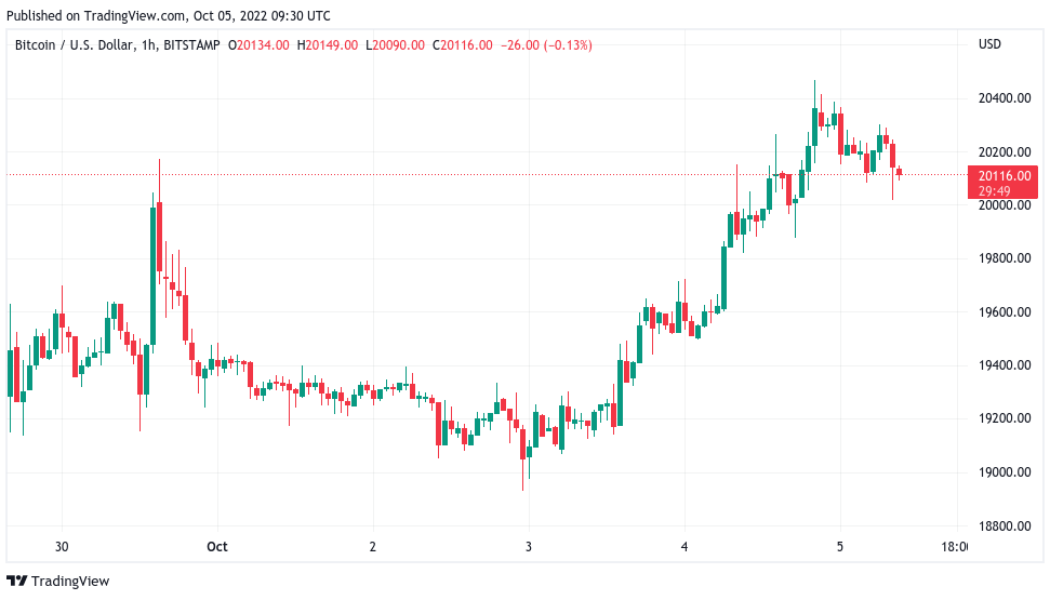
Bitcoin (BTC) held $20,000 into Oct. 5 with trader targets still including a fresh high before rejection. BTC/USD 1-hour candle chart (Bitstamp). Source: TradingView $21,000 upside target to precede new lows Data from Cointelegraph Markets Pro and TradingView showed BTC/USD reaching $20,470 on Bitstamp overnight before returning lower. The pair succeeded in maintaining the 2017 old all-time high as support, something on-chain analytics resource Material Indicators had hoped would endure as a positive sign. “BTC is still in a congested range,” it summarized in comments the day prior. “The retest of technical resistance at the 50-Day MA was rejected. Now I want to see a retest of support at the 2017 Top. Bulls may be losing momentum, but placed a buy wall at $20k to hold price up.” Material ...
Bitcoin price sees first October spike above $20K as daily gains hit 5%
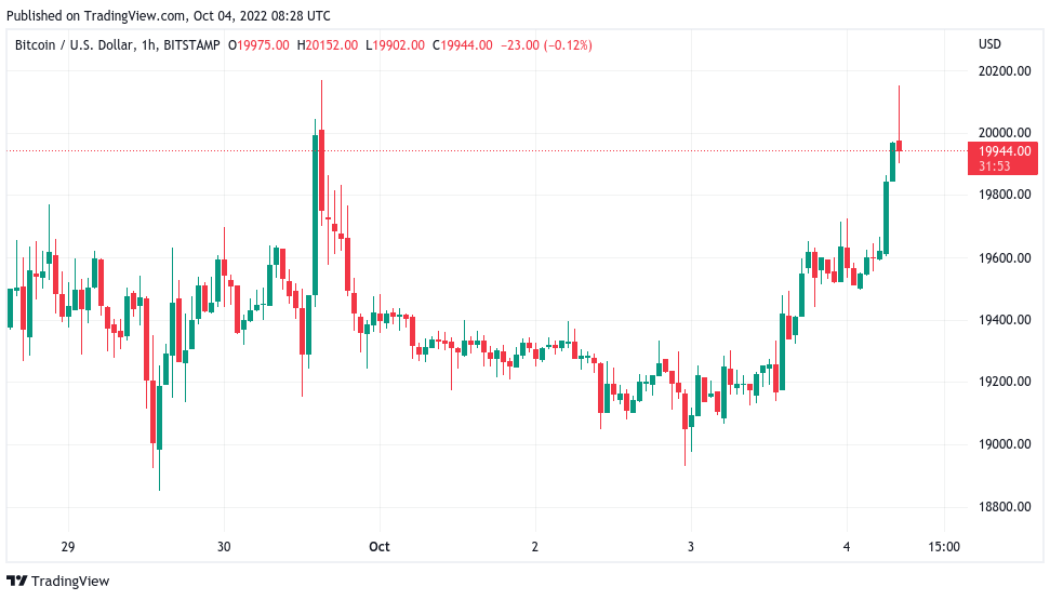
Bitcoin (BTC) saw its first trip above $20,000 on Oct. 4 as traders expected familiar resistance to cap gains. BTC/USD 1-hour candle chart (Bitstamp). Source: TradingView Multi-week dollar lows fuel Bitcoin bulls Data from Cointelegraph Markets Pro and TradingView showed BTC/United States dollar climbing prior to the Wall Street open, up over 5% in 24 hours. The pair had shaken off macroeconomic concerns at the start of the week, with trouble at Credit Suisse and the escalating Russia-Ukraine conflict failing to slow performance. Now, the short-term analysis focused on a run potentially topping out closer to $21,000 — as was the case late last month, as sell-side pressure at that level remained significant. “20500-21000 is a sell zone. If price gets there, which should, don’t be too bullis...


