BTC price
Bitcoin realized price bands form key resistance as bulls lose $24K
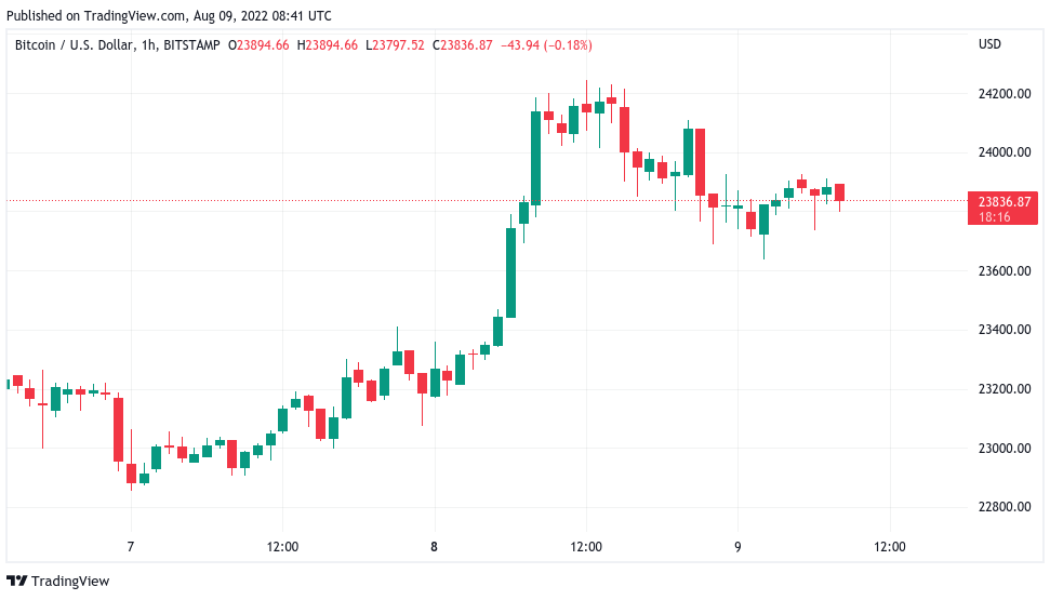
Bitcoin (BTC) consolidated lower on Aug. 9 after familiar resistance preserved a multi-month trading range. BTC/USD 1-hour candle chart (Bitstamp). Source: TradingView Bitcoin navigates whale price ladder Data from Cointelegraph Markets Pro and TradingView showed BTC/USD falling under the $24,000 mark overnight after rejecting near $24,200. The pair had seen swift gains to start the week but momentum faded as the top of the trading range in place since mid-June came closer. As such, bulls failed to reclaim new ground or even match the highs seen at the end of July, and the status quo thus continued. At the time of writing, BTC/USD was consolidating near $23,800. For on-chain analytics resource Whalemap, it was realized price that was now forming major levels to overcome. In a Tw...
Ethereum price rises by 50% against Bitcoin in one month — but there’s a catch
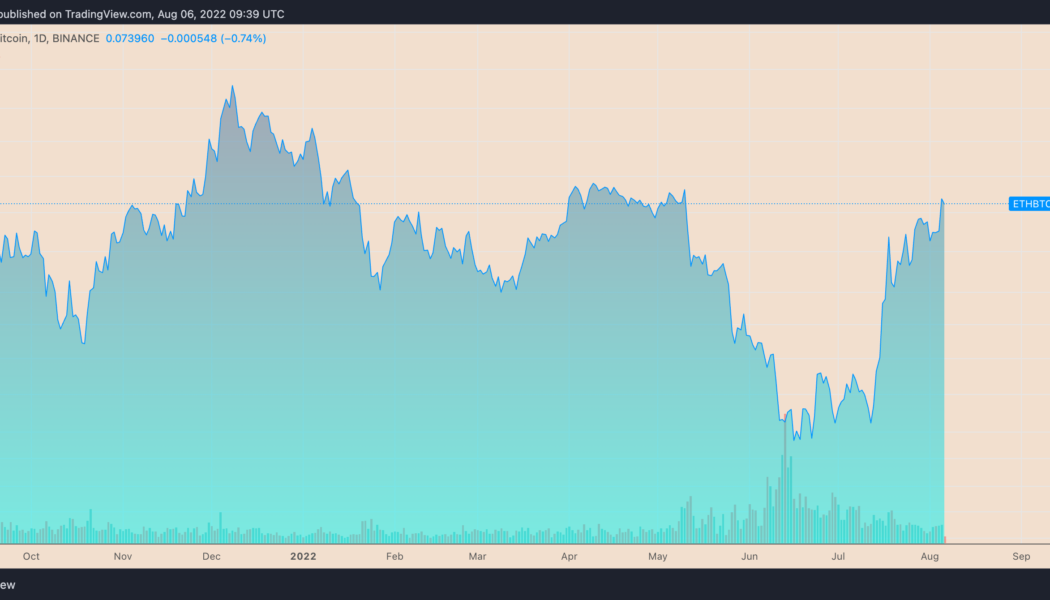
Ether (ETH), Ethereum’s native toke, has been continuing its uptrend against Bitcoin (BTC) as euphoria around its upcoming network upgrade, “the Merge,” grows. ETH at multi-month highs against BTC On the daily chart, ETH/BTC surged to an intraday high of 0.075 on Aug. 6, following a 1.5% upside move. Meanwhile, the pair’s gains came as a part of a broader rebound trend that started a month ago at 0.049, amounting to approximately 50% gains. ETH/BTC daily price chart. Source: TradingView The ETH/BTC recovery in part has surfaced due to the Merge, which will have Ethereum switch from proof-of-work (PoW) mining to proof-of-stake (PoS). Ethereum’s “rising wedge” suggests sell-off From a technical perspective, Ether stares at potential interim loss...
Bitcoin price: weekend volatility ‘expected’ with $22K level to hold
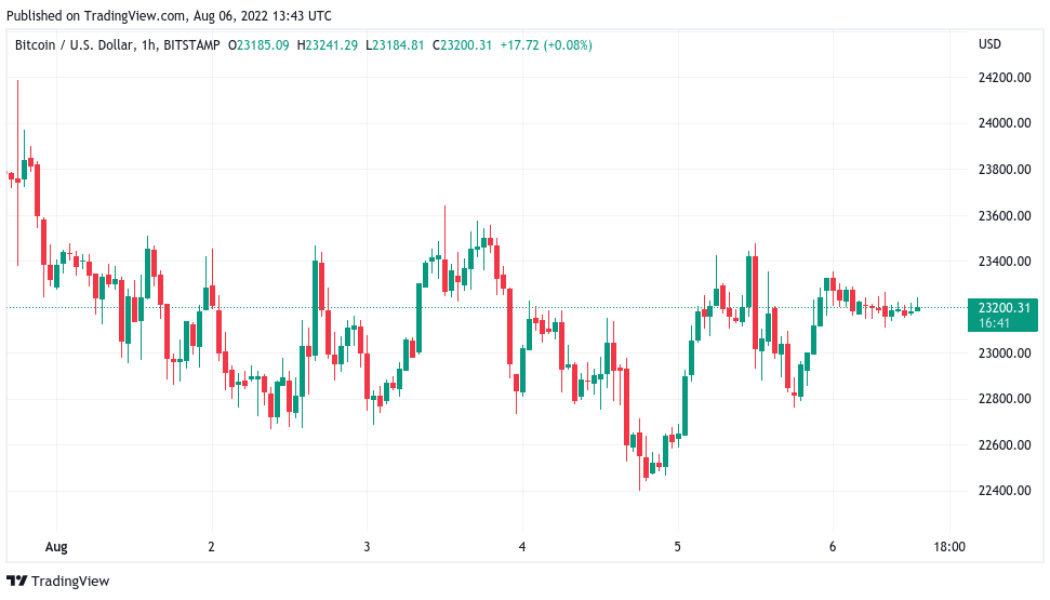
Bitcoin (BTC) rose above $23,000 again into Aug. 6 as new analysis predicted a potential surge of 20% or more. BTC/USD 1-hour candle chart (Bitstamp). Source: TradingView Daily chart gives trader $30,000 target Data from Cointelegraph Markets Pro and TradingView showed BTC/USD climbing overnight to once again sit near the top of its established trading range. After multiple attempts to break out above range resistance at $23,500, the pair appeared still stuck in limbo at the time of writing, but hopes of bullish continuation were already there. “Expecting more volatility over the wknd,” on-chain monitoring resource Material Indicators wrote in part of its latest Twitter update on Aug. 5. “If the Bear Market Rally can push BTC above 25k there isn’t much friction to 26k – 28k ran...
Bitcoin fails to beat $23.4K sellers as US payrolls upend inflation debate
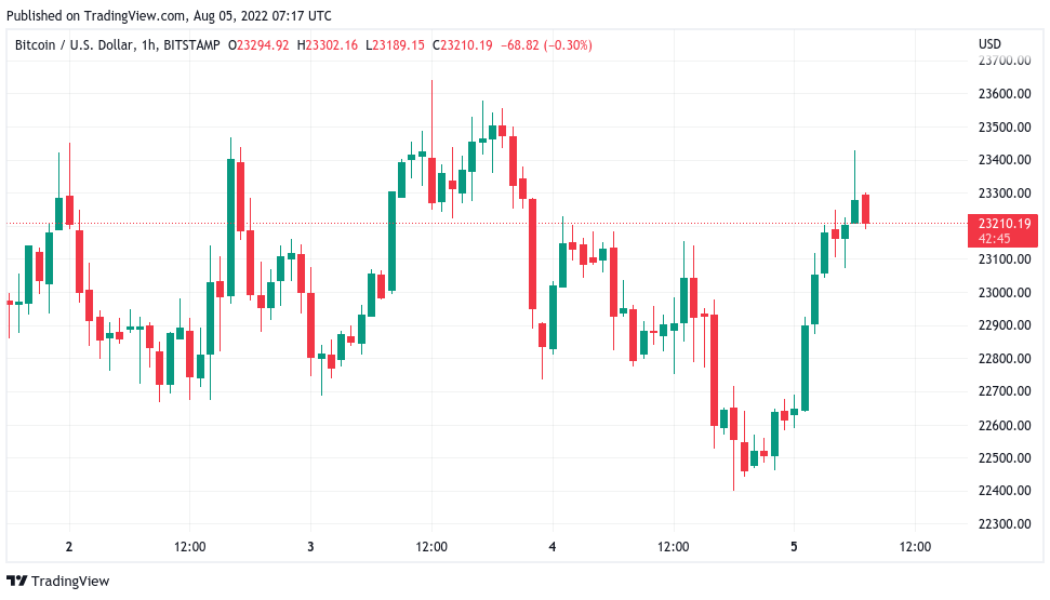
Bitcoin (BTC) saw fresh rejection at $23,500 resistance on Aug. 5 as United States equities failed to embrace surprisingly strong payroll data. BTC/USD 1-hour candle chart (Bitstamp). Source: TradingView “Collapsing real wages” poke fun at payroll print Data from Cointelegraph Markets Pro and TradingView followed BTC/USD as bears kept the market in its intraday trading range. Wall Street opened with a whimper despite U.S. payrolls for July coming in at twice estimated levels. The curious reaction had some analysts arguing that the numbers did not in fact show economic strength, but rather existing workers taking on second jobs due to inflation. “The gain of 528K jobs in July as the labor force participation rate fell to 62.1, means that most of the new jobs went to people who a...
Bitcoin price reaches $23.4K on 4.6% gains amid ‘very mixed’ outlook
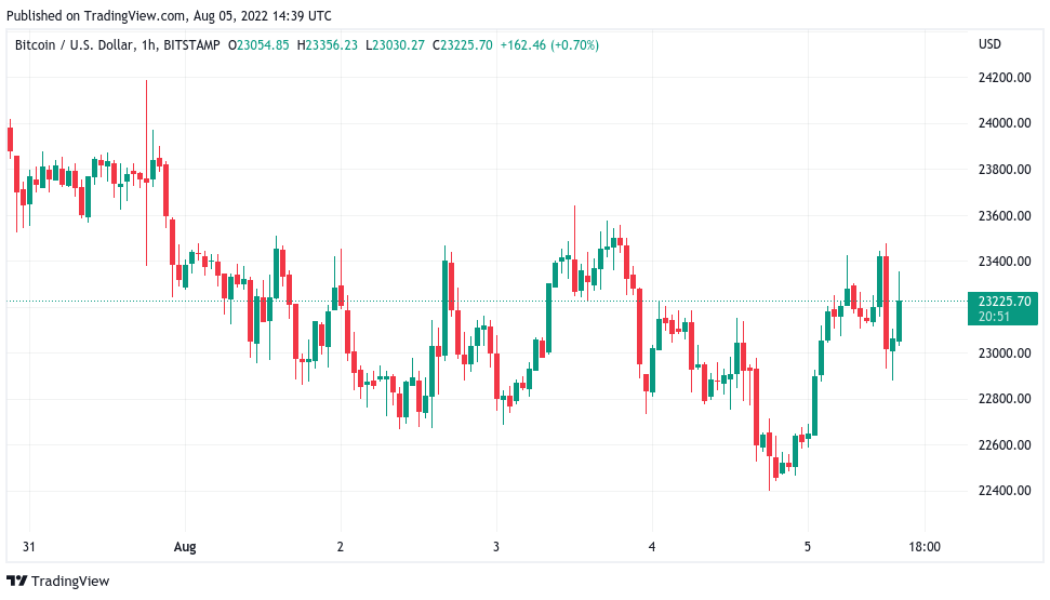
Bitcoin (BTC) rebounded overnight into Aug. 5 as a fresh trendline reclaim opened the door to further gains. BTC/USD 1-hour candle chart (Bitstamp). Source: TradingView Daily BTC pricechart sets up “tentative” long signal Data from Cointelegraph Markets Pro and TradingView showed BTC/USD bouncing off a local bottom at $22,400 to add around 4.6%. The pair had reversed direction right at key bid support on major exchange Binance, this helping avoid a more substantial loss of the 200-week moving average (MA) at around $22,800. While that key zone remained uncertain for bulls, a reclaim of the 21-period MA on the daily chart gave on-chain analytics resource Material Indicators cause for optimism. BTC/USD might not spark a long signal at the daily candle close, it told Twitter follo...
MicroStrategy stock MSTR hits 3-month high after CEO’s exit
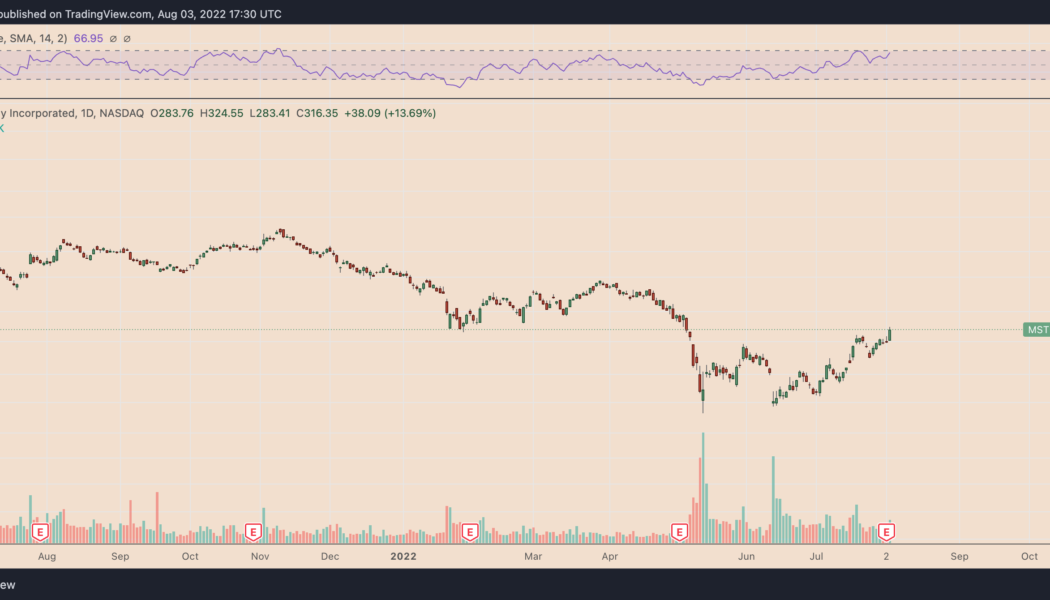
MicroStrategy (MSTR) stock opened higher on Aug. 3 as investors digested the news of its CEO Michael Saylor’s exit after a depressive quarterly earnings report. Microstrategy stock up 142% since May lows On the daily chart, MSTR’s price surged by nearly 14.5% to $324.55 per share, the highest level since May 6. The stock’s intraday gains came as a part of a broader recovery that started on May 12 at $134. Since then, MSTR has grown by 142% versus Nasdaq’s 26.81% gains in the same period. MSTR daily price chart. Source: TradingView Bad Q2, Saylor’s resignation The Aug. 3 MSTR rally came a day after MicroStrategy reported a billion dollar loss in its second quarter (Q2) earnings call. Interestingly, the company’s major Bitcoin exposure was a large re...
Best monthly gains since October 2021 — 5 things to know in Bitcoin this week
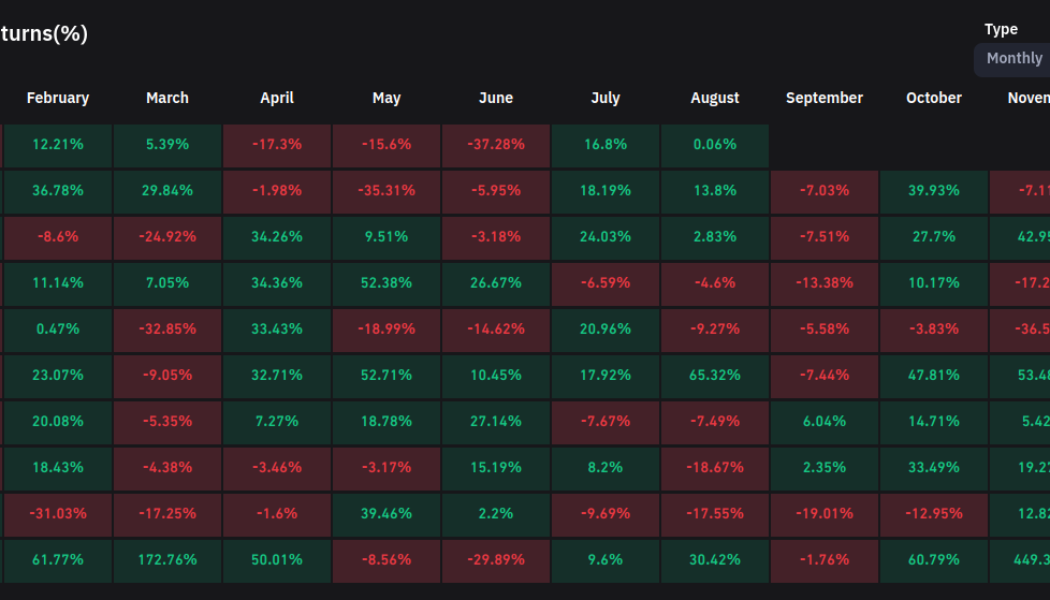
Bitcoin (BTC) starts a new week and a new month on a cautiously positive footing after protecting crucial levels. After an intense July in which macro factors provided significant volatility, BTC price action managed to provide both a weekly and monthly candle favoring the bulls. The road to some form of recovery continues, and at some points in recent weeks, it seemed like Bitcoin would suffer even harder on the back of June’s 40% losses. Now, however, there is already a sense of optimism among analysts, but one thing remains clear — this “bear market rally” does not mean the end of the tunnel yet. As Summer 2022 enters its final month, Cointelegraph takes a look at the potential market triggers at play for Bitcoin as it lingers near its highest levels since mid-June. Spot price snatches ...
Bitcoin due ‘one of greatest bull markets’ as July gains circle 20%
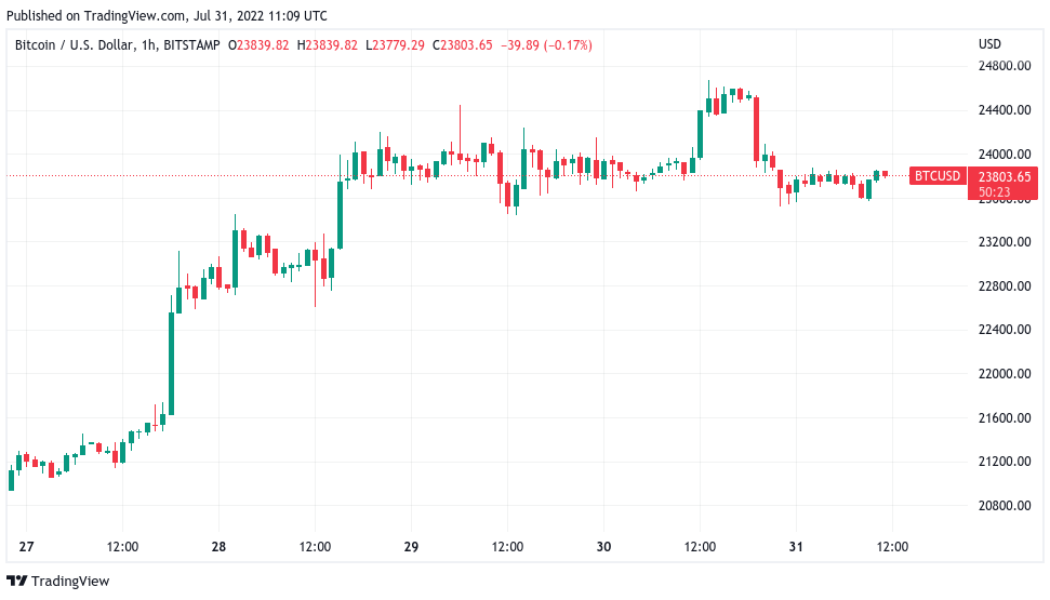
Bitcoin (BTC) spoofed a breakout to fresh six-week highs into July 31 as a showdown for both the weekly and monthly close drew near. BTC/USD 1-hour candle chart (Bitstamp). Source: TradingView “Bart Simpson” greets traders into BTC monthly close Data from Cointelegraph Markets Pro and TradingView showed BTC/USD canceling out all its gains from early in the weekend, dropping from $24,670 to $23,555 in hours. The resulting chart structure was all too familiar to long-term market participants, creating a “Bart Simpson” shape on hourly timeframes. Liquidations nonetheless remained manageable, with the cross-crypto tally totaling $150 million in the 24 hours to the time of writing, according to data from analytics resource Coinglass — less than on previous days. Crypto liquidations chart. ...
Bitcoin bear market over, metric hints as BTC exchange balances hit 4-year low
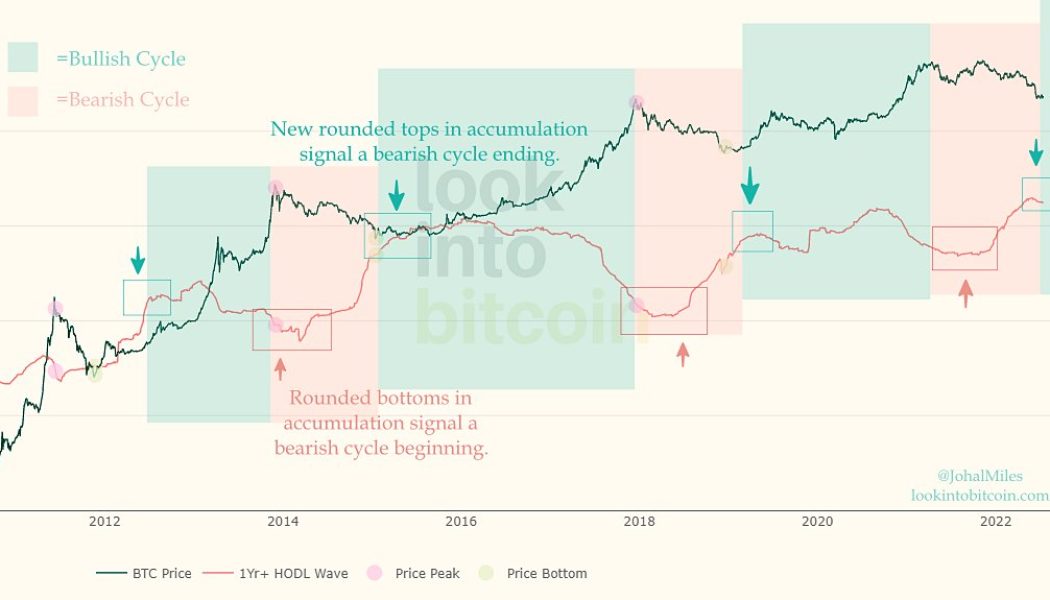
Bitcoin (BTC) may already be beginning its new macro uptrend if historical “hodl” habits repeat. That was the conclusion from research into the latest data covering the amount of the BTC supply dormant for one year or more as of July 2022. Hodled BTC hints that the bear market is over According to independent analyst Miles Johal, who uploaded the findings to social media on July 29, a “rounded top” formation in “hodled” BTC is in the process of completing. Once it does, the price should react — just like on multiple occasions before. The clue lies in Bitcoin’s HODL Waves metric, which breaks down the supply according to when each Bitcoin last moved. One year ago or more — the one-year HODL Wave — currently reflects the majority of the supply. Johal’s accompanying ch...
Historically accurate Bitcoin metric exits buy zone in ‘unprecedented’ 2022 bear market
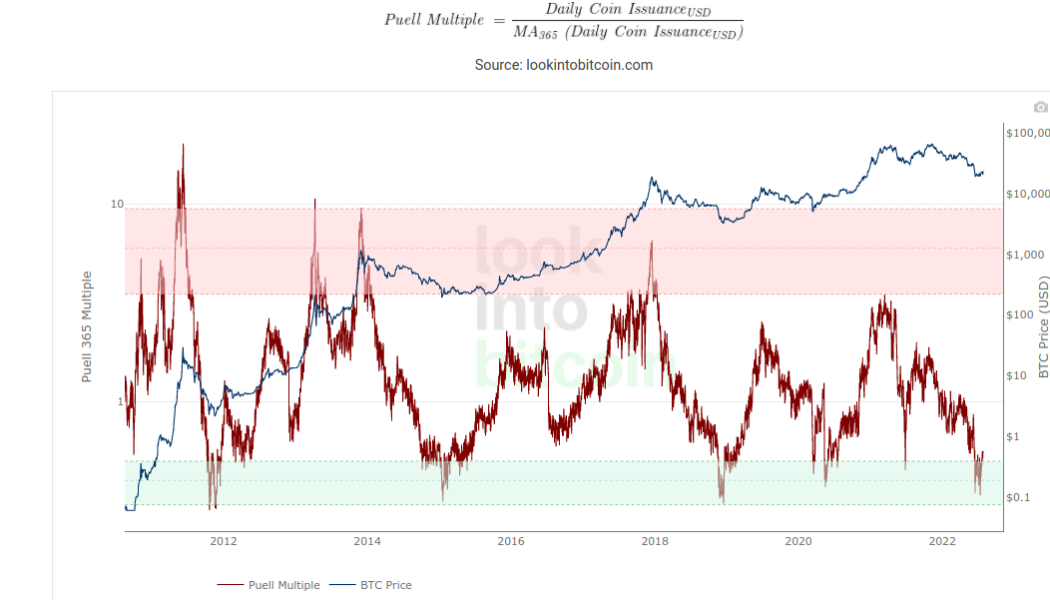
Bitcoin (BTC) is enjoying what some are calling a “bear market rally” and has gained 20% in July, but price action is still confusing analysts. As the July monthly close approaches, the Puell Multiple has left its bottom zone, leading to hopes that the worst of the losses may be in the past. Puell Multiple attempts to cement breakout The Puell Multiple one of the best-known on-chain Bitcoin metrics. It measures the value of mined bitcoins on a given day compared to the value of those mined in the past 365 days. The resulting multiple is used to determine whether a day’s mined coins is particularly high or low relative to the year’s average. From that, miner profitability can be inferred, along with more general conclusions about how overbought or oversold the market...
Bitcoin price eyes $24K July close as sentiment exits ‘fear’ zone
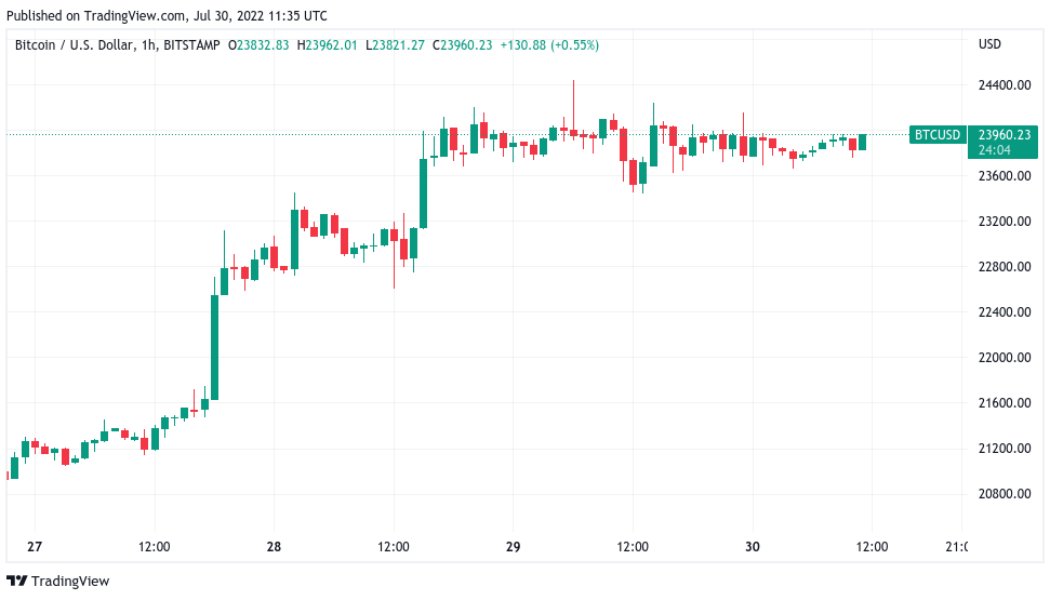
Bitcoin (BTC) dropped volatility on the last weekend of July as the monthly close drew near. BTC/USD 1-hour candle chart (Bitstamp). Source: TradingView 200-week moving average in focus for July close Data from Cointelegraph Markets Pro and TradingView showed BTC/USD retaining $24,000 as resistance into July 30. The pair had benefitted from macro tailwinds across risk assets in the second half of the week, these including a flush finish for United States equities. The S&P 500 and Nasdaq Composite Index gained 4.1% and 4.6% over the week, respectively. With off-speak trading apt to spark volatile conditions into weekly and monthly closes thanks to thinner liquidity, however, analysts warned that anything could happen between now and July 31. “Just gonna sit back and watch the market up ...
Bitcoin price rejects at $24K as ‘classic short setup’ spoils bulls’ fun
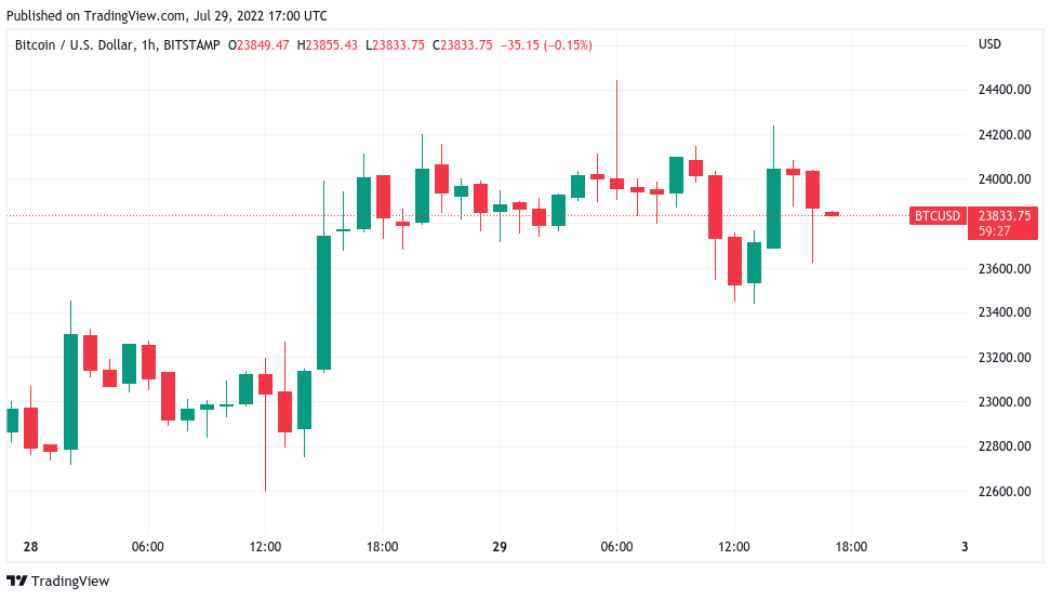
Bitcoin (BTC) saw fresh volatility after July’s final Wall Street open as highs north of $24,000 remained solid resistance. BTC/USD 1-hour candle chart (Bitstamp). Source: TradingView Resistance strikes BTC at $24,000 Data from Cointelegraph Markets Pro and TradingView reflected bulls’ continuing struggle as BTC/USD lurched around the $24,000 mark on July 29. The pair had attempted to match the week’s local top of $24,450, this ultimately failing to materialize as a resurgent U.S. dollar pressured crypto despite the gains of U.S. stocks . The U.S. dollar index (DXY) continued higher during the Wall Street trading, passing 106 after falling to its lowest levels since July 5. U.S. dollar index (DXY) 1-hour candle chart. Source: TradingView Record eurozone inflation&nbs...
