Anchor Protocol
Anchor Protocol rebounds sharply after falling 70% in just two months — what’s next for ANC?
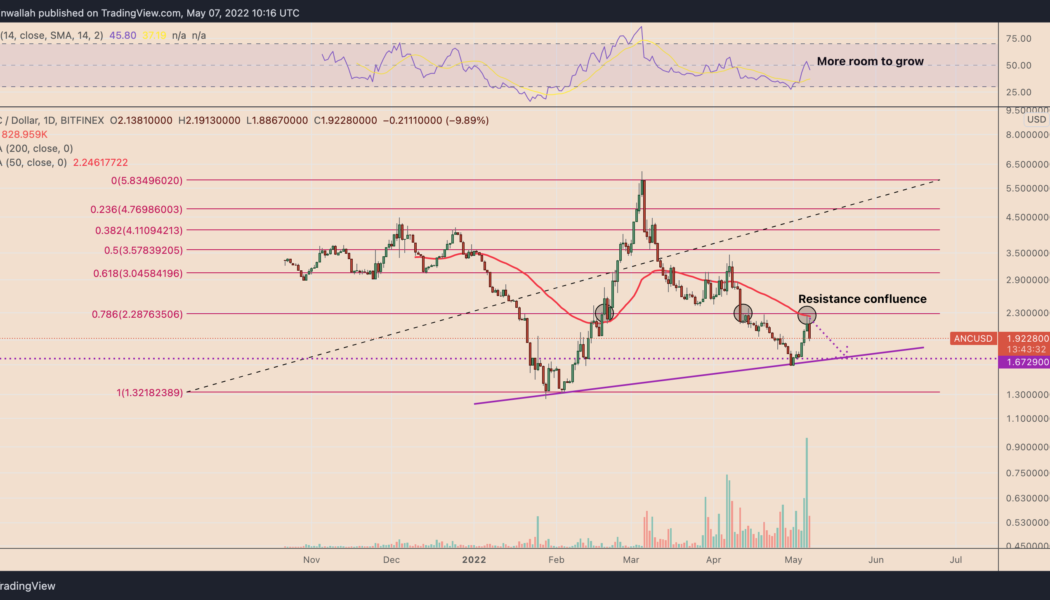
Anchor Protocol (ANC) returned to its bullish form this May after plunging by over 70% in the previous two months. Pullback risks ahead ANC’s price rebounded by a little over 42.50% between May 1 and May 6, reaching $2.26, its highest level in three weeks. Nonetheless, the token experienced a selloff on May 6 and May 7 after ramming into what appears to be a resistance confluence. That consists of a 50-day exponential moving average (50-day EMA; the red wave) and 0.786 Fib line of the Fibonacci retracement graph, drawn from the $1.32-swing low to the $5.82-swing high, as shown in the chart below. ANC/USD daily price chart. Source: TradingView A continued pullback move could see ANC’s price plunging towards its rising trendline support, coinciding with the floor near&...

