Altcoin
Avalanche price eyes 30% jump in June with AVAX’s classic bullish reversal pattern
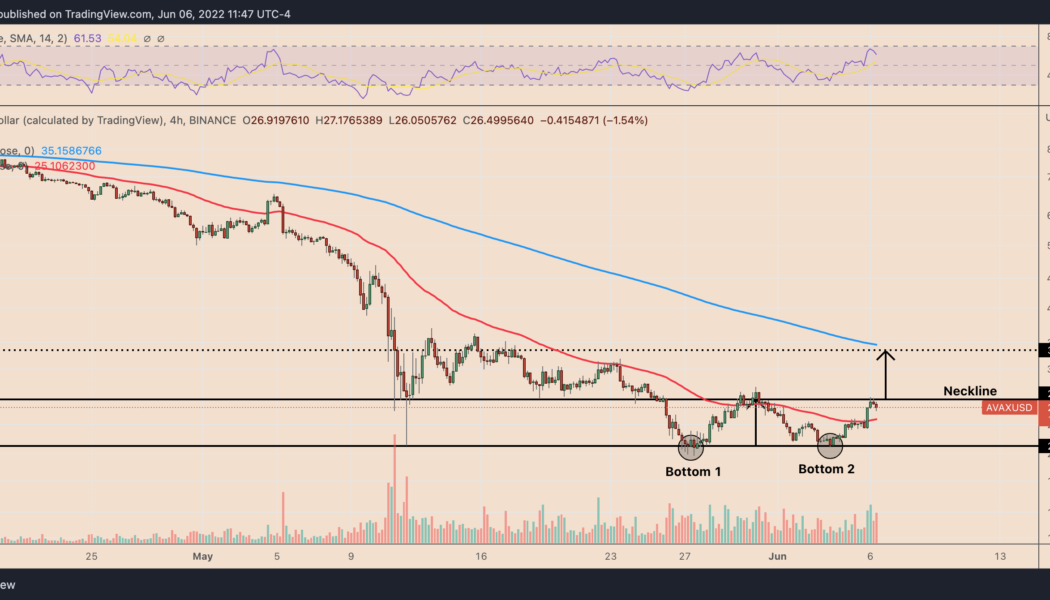
Avalanche (AVAX) shows signs of continuing its ongoing rebound move as it paints a classic bullish reversal pattern. AVAX price to $35? Dubbed as “double bottom,” the pattern appears when the price establishes a support level, rebounds, corrects after finding a resistance level, pulls back toward the previous support and bounces back toward the resistance level to pursue a breakout. Since May 27, AVAX’s price trends appear like those typically witnessed during the double bottom formation. Specifically, the AVAX/USD pair on the four-hour chart has bounced twice after testing the same support level near $22.25, and now eyes a breakout above its resistance level — also called “neckline” — near $27.50. AVAX/USD four-hour price chart with “double bottom'...
Is Solana a ‘buy’ with SOL price at 10-month lows and down 85% from its peak?
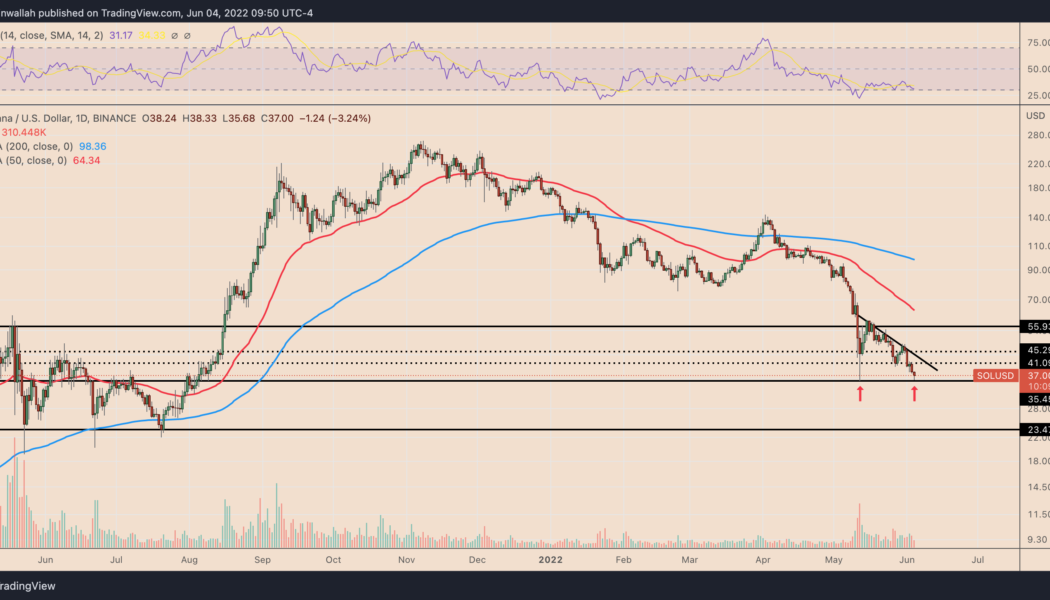
Solana’s (SOL) price dropped on June 3, bringing its net paper losses down to 85% seven months after topping out above $260. SOL price fell by more than 6.5% intraday to $35.68, after failing to rebound with conviction from 10-month lows. Now sitting on a historically significant support level, the SOL/USD pair could see an upside retracement in June, eyeing the $40-$45 area next, up around 25% from today’s price. SOL/USD daily price chart. Source: TradingView 60% SOL price decline ahead? However, a rebound scenario is far from guaranteed and Solana faces headwinds from trading in lockstep with Bitcoin (BTC), the top cryptocurrency (by market cap) that typically influences trends across the top altcoins. Notably, the weekly correlation coefficient between BTC and SO...
STEPN rebounds sharply after falling 80% in a month — is GMT price bottoming out?
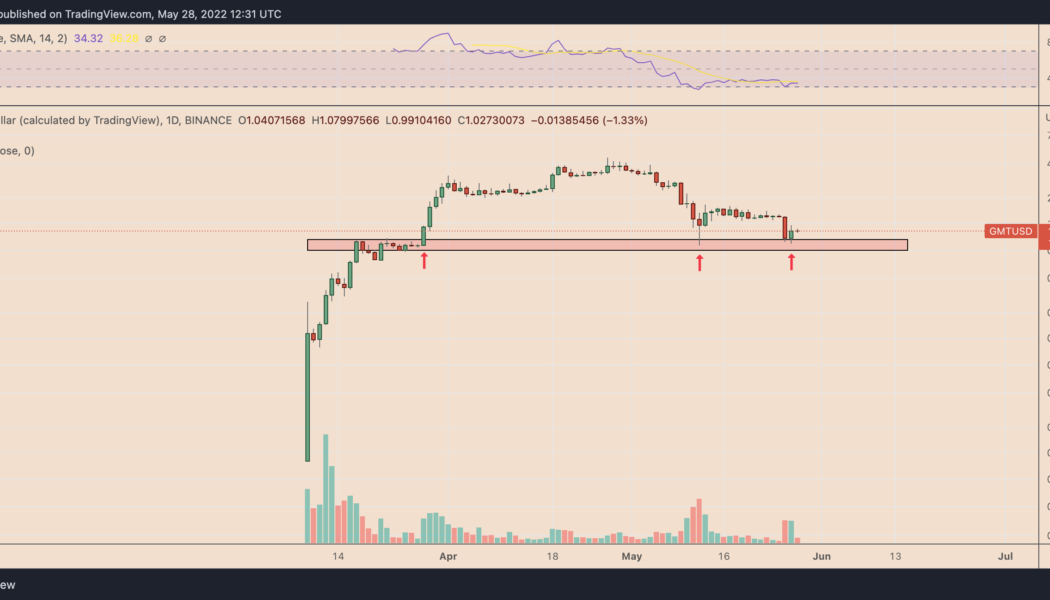
A massive downtrend in the STEPN (GMT) prices witnessed in the last 30 days appears to be nearing exhaustion. GMT’s price has rebounded by nearly 35%—from $0.80 on May 27 to $0.99 on May 28. Interestingly, the upside retracement started after the price fell in the same range, which had acted as support before GMT’s 500% and 120% price rallies in March and early May, respectively. GMT/USD daily price chart. Source: TradingView Additionally, the rebound further preceded an 80% drop from its record high of $4.50, established on April 27, which left GMT oversold, per its daily relative strength index reading that slipped below the oversold threshold of 30 on May 26. The technical support, in addition to oversold RSI, suggests GMT is in the process of bottoming out. GMT price levels...
Spooky Solana breakdown begins with SOL price facing a potential 45% drop — Here’s why
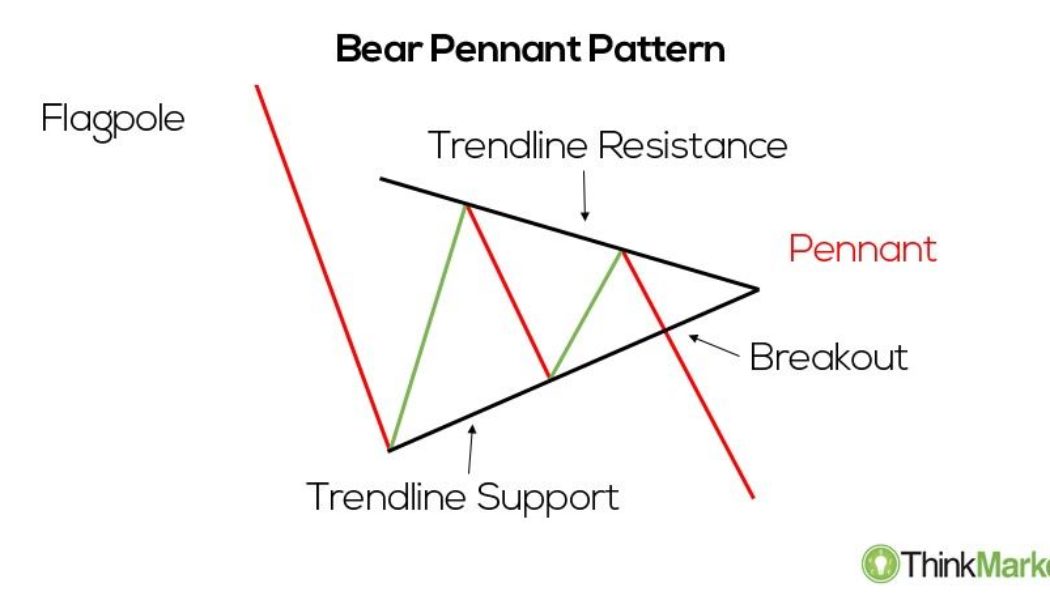
Solana (SOL) dropped on May 26, continuing its decline from the previous day amid a broader retreat across the crypto market. SOL price pennant breakdown underway SOL price fell by over 13% to around $41.60, its lowest level in almost two weeks. Notably, the SOL/USD pair also broke out of what appears to be like a “bear pennant,” a classic technical pattern whose occurrences typically precede additional downside moves in a market. In detail, bear pennants appear when the price trades inside a range defined by a falling trendline resistance and rising trendline support. Bear pennant pattern. Source: ThinkMarkets These patterns resolve after the price breaks below the lower trendline, accompanied by higher volumes. As a rule of technical analysis, traders decide the pennant’...
ApeCoin rebounds after APE price crashes 80% in two weeks: Dead cat bounce or bottom?
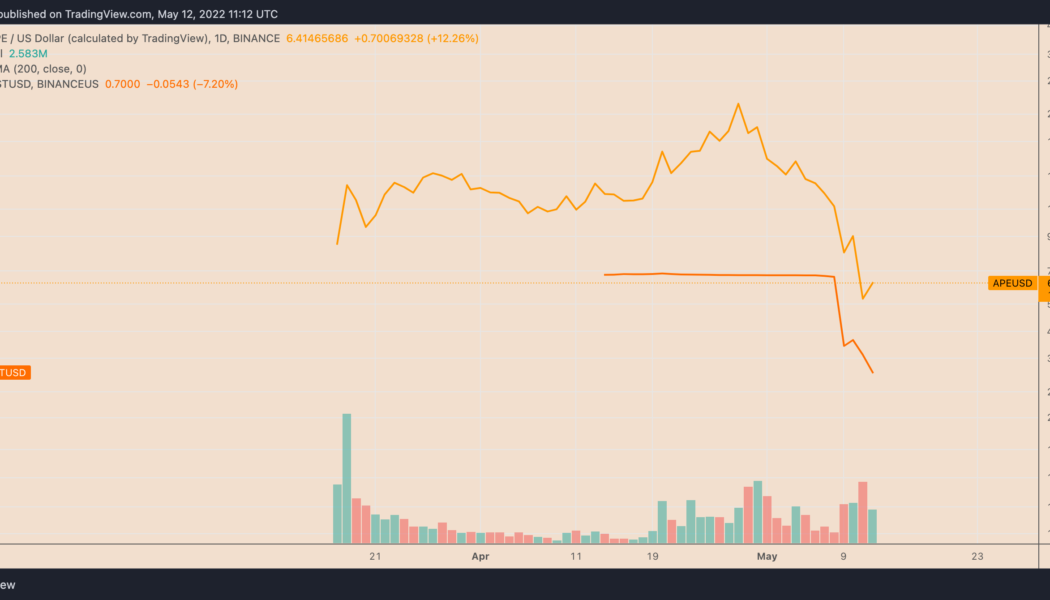
ApeCoin (APE) has undergone a sharp recovery after falling to its lowest level in two months. But its strong correlation with Bitcoin (BTC) and U.S. equities amid macro risks suggests more losses could be in store. APE rebounds after 80% losses in two weeks APE rebounded by nearly 45% to $7.30 on May 12. The upside retracement move came after APE dropped circa 81% to $5 on May 11, from its record high near $27.50, established on April 28. The seesaw price action mirrored similar volatile moves elsewhere in the crypto market, led by the chaos around TerraUSD (UST) — an “algorithmic stablecoin” whose value plunged to $0.23 earlier this week, and the Federal Reserve’s hawkish response to rising inflation. APE/USD versus USTUSD. Source: TradingView Meanwhile, the correla...
Monero avoids crypto market rout, but XMR price still risks 20% drop by June
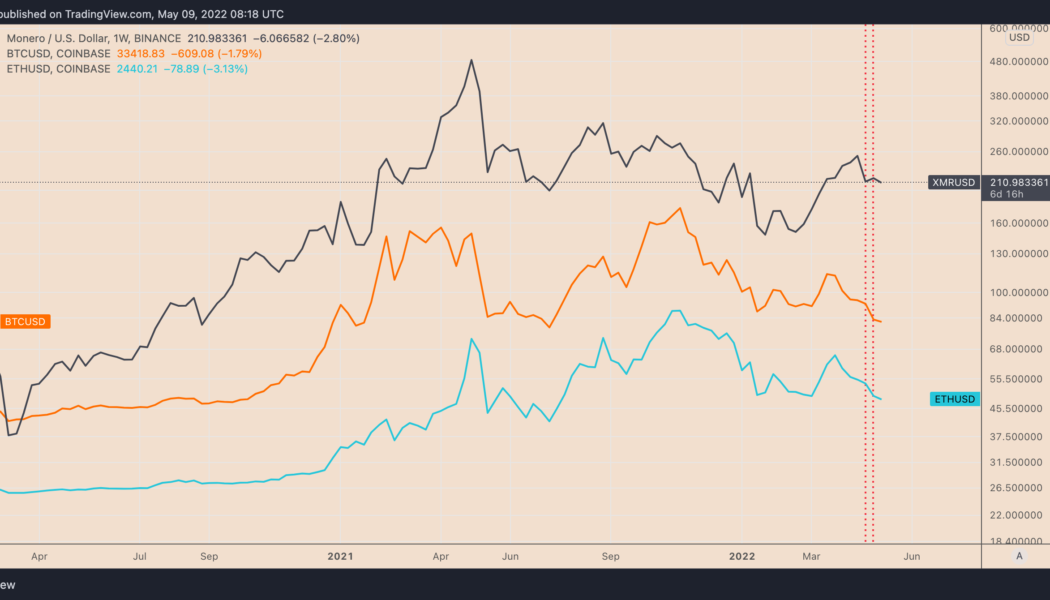
Monero (XMR) has shown a surprising resilience against the United States Federal Reserve’s hawkish policies that pushed the prices of most of its crypto rivals — including the top dog Bitcoin (BTC) — lower last week. XMR price closed the previous week 2.37% higher at $217, data from Binance shows. In comparison, BTC, which typically influences the broader crypto market, finished the week down 11.55%. The second-largest crypto, Ether (ETH), also plunged 11% in the same period. XMR/USD vs. BTC/USD vs. ETH/USD weekly price chart. Source: TradingView While the crypto market wiped off $163.25 billion from its valuation last week, down nearly 9%, Monero’s market cap increased by $87.7 million, suggesting that many traders decided to seek safety in this privacy-focused coin. XMR near ...
LUNA drops 20% in a day as whale dumps Terra’s UST stablecoin — selloff risks ahead?
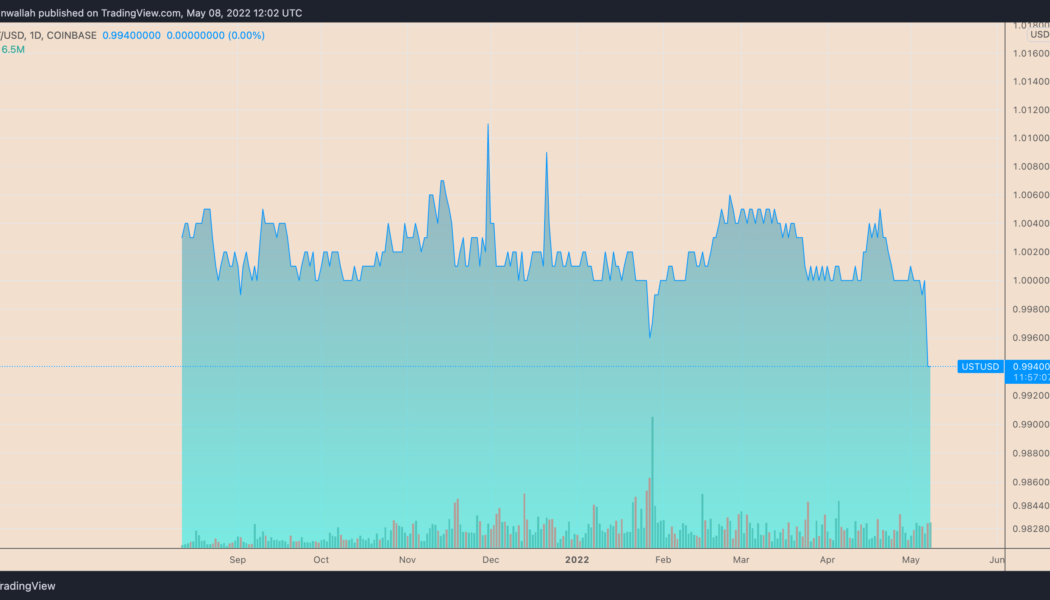
Terra (LUNA) has plunged significantly after witnessing a FUD attack on its native stablecoin TerraUSD (UST). The LUNA/USD pair dropped 20% between May 7 and May 8, hitting $61, its worst level in three months, after a whale mass-dumped $285 million worth of UST. As a result of this selloff, UST briefly lost its U.S. dollar peg, falling to as low as $0.98. UST daily price chart. Source: TradingView Excessive LUNA supply LUNA serves as a collateral asset to maintain UST’s dollar peg, according to Terra’s elastic monetary policy. Therefore, when the value of UST is above $1, the Terra protocol incentivizes users to burn LUNA and mint UST. Conversely, when UST’s price drops below $1, the protocol rewards users for burning UST and minting LUNA. Therefore, during UST supp...
Anchor Protocol rebounds sharply after falling 70% in just two months — what’s next for ANC?
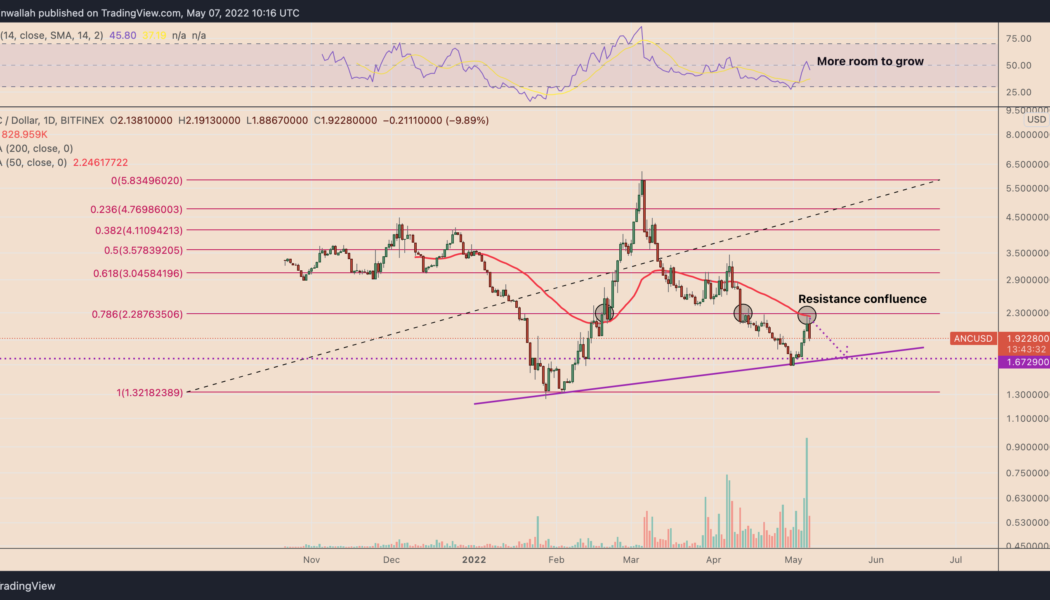
Anchor Protocol (ANC) returned to its bullish form this May after plunging by over 70% in the previous two months. Pullback risks ahead ANC’s price rebounded by a little over 42.50% between May 1 and May 6, reaching $2.26, its highest level in three weeks. Nonetheless, the token experienced a selloff on May 6 and May 7 after ramming into what appears to be a resistance confluence. That consists of a 50-day exponential moving average (50-day EMA; the red wave) and 0.786 Fib line of the Fibonacci retracement graph, drawn from the $1.32-swing low to the $5.82-swing high, as shown in the chart below. ANC/USD daily price chart. Source: TradingView A continued pullback move could see ANC’s price plunging towards its rising trendline support, coinciding with the floor near&...
Monero ‘falling wedge’ breakout positions XMR price for 75% rally
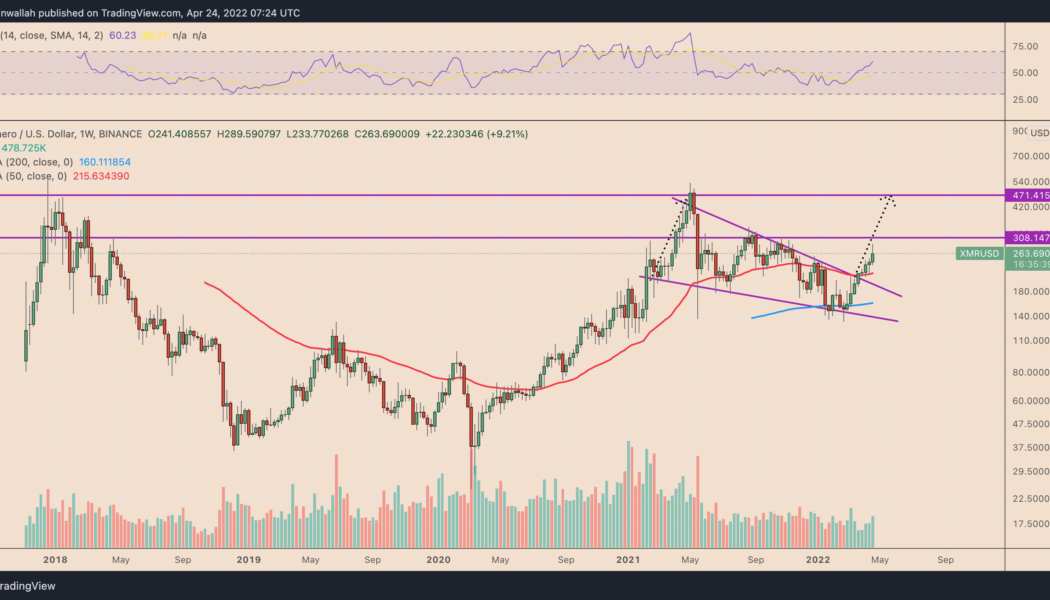
Monero (XMR) price dropped by nearly 10% three days after establishing a week-to-date high around $290 on April 24. Nonetheless, several technical indicators suggest that the XMR/USD pair is poised to resume its uptrend over the next few months. Falling wedge breakout underway Notably, XMR’s price broke out of its “falling wedge” structure in late March. It continued its move upside in the later daily sessions, with rising volumes indicating bullish sentiment among Monero traders. Traditional analysts consider falling wedges as bullish reversal patterns, i.e., the price first consolidates within a contracting, descending channel, followed by a strong bounce to the upside. As a rule, the falling wedge’s breakout target comes to be near the level at length equal to th...
DeFi token AAVE eyes 40% rally in May but ‘bull trap’ risks remain
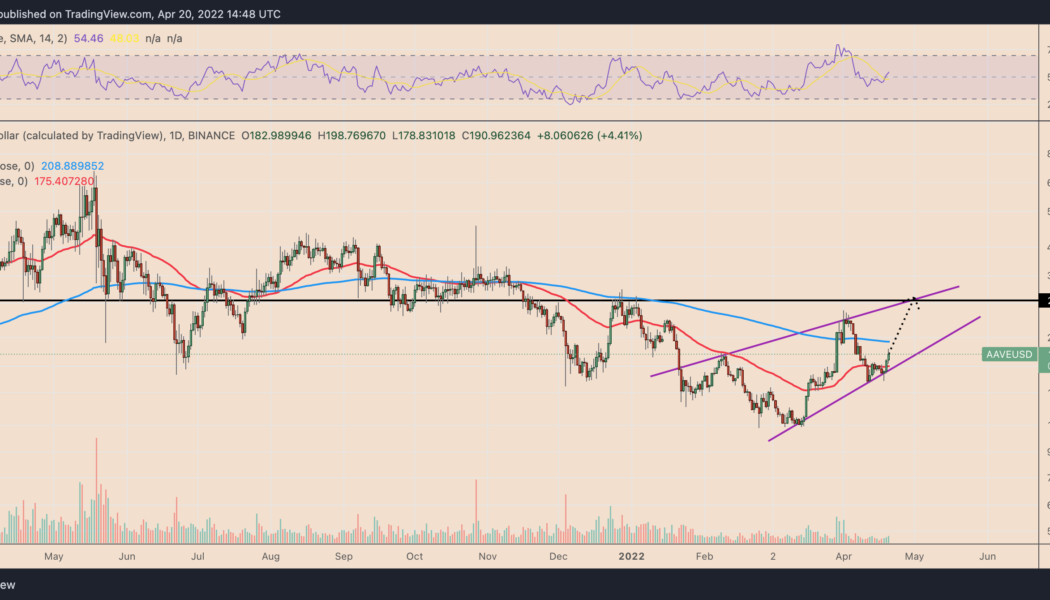
A sharp rebound move witnessed in the Aave (AAVE) market in the last three days has raised its potential to rise further in May, a technical indicator suggests. AAVE price rebounds from key support Dubbed a “rising wedge,” the pattern appears when the price rises inside a range defined by two ascending, contracting trendlines. It typically resolves after the price breaks below the lower trendline with convincingly rising volumes. AAVE has been painting a similar ascending channel since early February 2022. The AAVE/USD pair has bounced in the past few days after testing the wedge’s lower trendline as support. This means the bulls are now eyeing the pattern’s upper trendline near $280, up over 40% from April 20’s price. AAVE/USD daily price chart. Sou...
Solana’s STEPN hits record high as GMT price skyrockets 34,000% in over a month
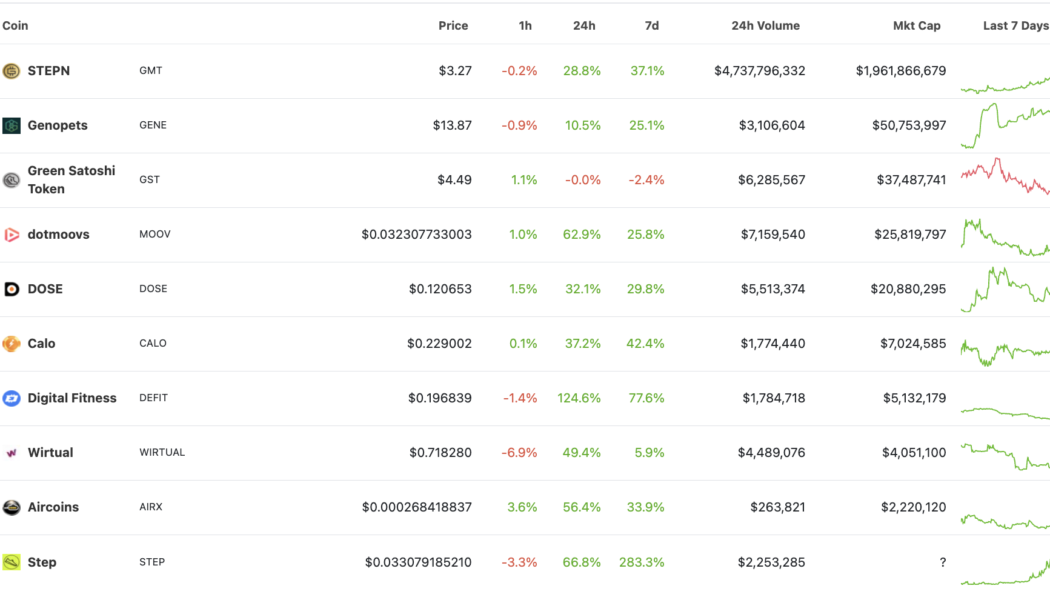
STEPN (GMT), a so-called “move-to-earn” token using the Solana (SOL) blockchain, has soared incredibly since its market debut in March. GMT’s price jumped from $0.01 on March 9 to a record high of $3.45 on April 19 — a 34,000% upside move in just 41 days (data from Binance). Its massive uptrend appeared primarily due to the hype surrounding decentralized finance (DeFi) projects that reward users in tokens for staying active. For instance, the prices of GMT and its top rivals, including Genopets (GENE) and dotmoovs (MOOV), exploded massively on a 24-hour adjusted timeframe, data on CoinGecko shows. Nonetheless, STEPN remained the most valuable move-to-earn (M2E) project, with its market capitalization closing in on $2 billion. The performance of M2E tokens featu...
