Altcoin
NEXO risks 50% drop due to regulatory pressure and investor concerns
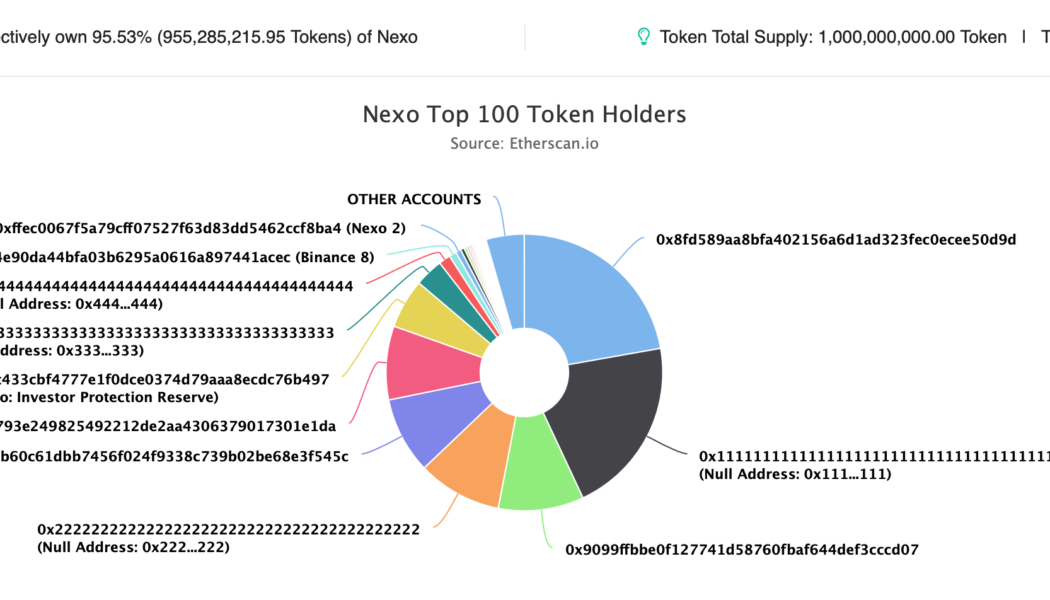
Crypto lending firm Nexo is at risk of losing half of the valuation of its native token by the end of 2022 as doubts about its potential insolvency grow in the market. Is Nexo too centralized? For the unversed: Eight U.S. states filed a cease-and-desist order against Nexo on Sep. 26, alleging that the firm offers unregistered securities to investors without alerting them about the risks of the financial products. In particular, regulators in Kentucky accused Nexo of being insolvent, noting that without its namesake native token, NEXO, the firm’s “liabilities would exceed its assets.” As of July 31, Nexo had 959,089,286 NEXO in its reserves — 95.9% of all tokens in existence. “This is a big, big, big problem because a very basic market analysis demonstrates that Nexo would be...
How crypto is playing a role in increasing healthy human lifespans
It’s a question that’s infatuated scientists for decades: how can we prolong life expectancy — giving humans everywhere more years of good health? This field is known as longevity science, and within this industry, experts argue care which regards ageing as a normal but treatable ailment are rare — and of the approaches available, they can only be accessed by those who are highly educated and privileged. Just some of the key tenets that govern this approach to medicine involve therapeutics, personalized medicine, predictive diagnostics and artificial intelligence. The goal is to eliminate a “one size fits all” attitude toward treatment, and ensure that therapies are customized to an individual’s unique medical profile. This can matter in many different ways — ...
Are there too many cryptocurrencies?
The cryptocurrency industry has grown at a staggering pace. There are now almost 21,000 different coins in existence, across a variety of subsectors. From metaverses to decentralized finance, investors are spoiled for choice. But a burning question, especially among crypto skeptics, is this: Are there too many cryptocurrencies? We’ve repeatedly seen how new altcoins can be created in the blink of an eye. Tokens popped up hours after Will Smith slapped Chris Rock at the Oscars — pumping and dumping on low liquidity. And following the death of Queen Elizabeth, the markets were flooded by a flurry of “memecoins” bearing her name. Some critics felt this was in poor taste and argued it was “a bad look for crypto.” Despite the proliferation of thousands of cry...
XRP price risks 30% decline despite Ripple’s legal win prospects
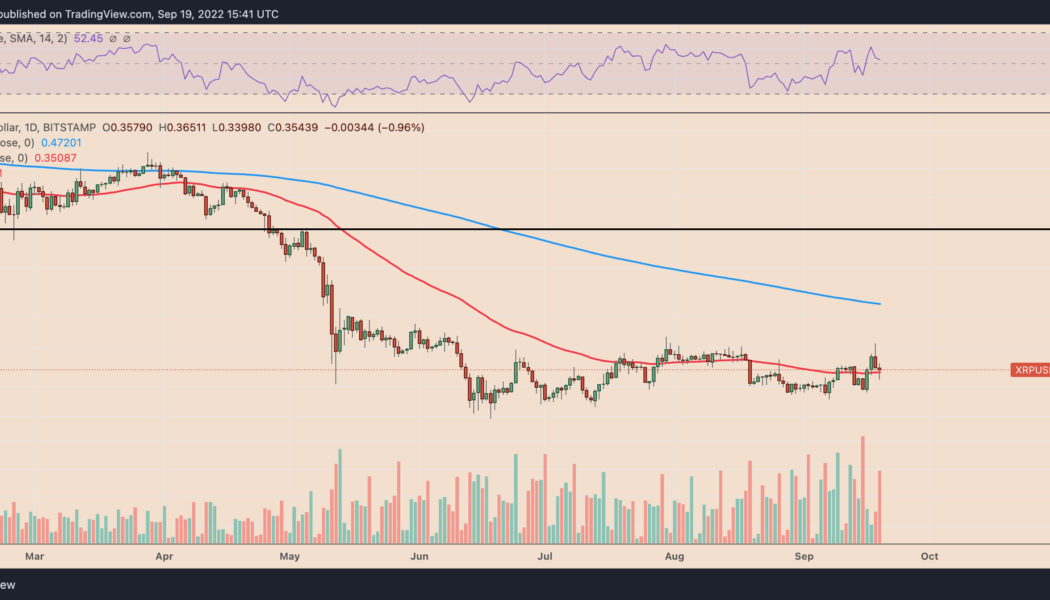
Ripple (XRP) price was wobbling between profits and losses on Sept. 19 despite hopes that Ripple would eventually win its long-running legal battle against the U.S. Securities and Exchange Commission (SEC). Ripple and the SEC both agreed to expedite the lawsuit on Friday to get an answer on whether $XRP is a security or not. From the updates of the case, it sounds like it’s in the favor of @Ripple pic.twitter.com/SAyl4VLxdM — Jeff Sekinger (@JeffSekinger) September 19, 2022 Fed spoils SEC vs. Ripple euphoria The XRP/USD pair dropped by over 1% to $0.35 while forming extremely sharp bullish and bearish wicks on its Sept. 19 daily candlestick. In other words, its intraday performance hinted at a growing bias conflict among traders. XRP/USD daily price chart. Source: TradingView The inde...
Dogecoin has crashed 75% against Bitcoin since Elon Musk’s SNL appearance
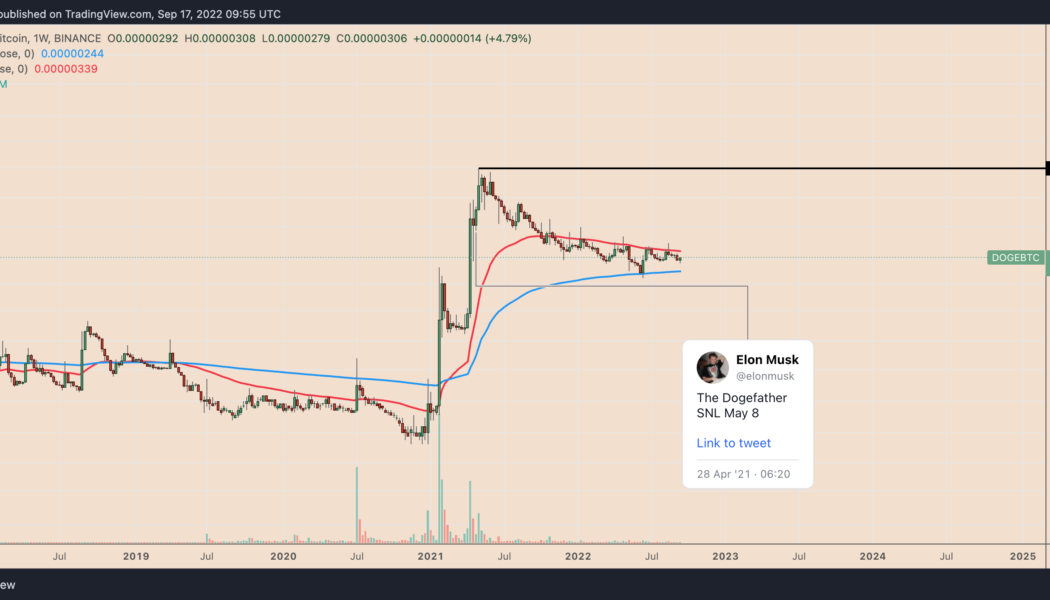
Dogecoin (DOGE) may be back in the top-ten cryptocurrency by market capitalization, but its loses in both USD and Bitcoin (BTC) terms since Elon Musk’s SNL appearance are considerable. Dogecoin loses Musk-effect The DOGE/BTC trading pair has fallen 75% after peaking out at 1,287 satoshis on May 9, 2021, a day after Musk was a guest host on Saturday Night Live, including a sketch titled “The Dogefather.” DOGE/BTC daily price chart. Source: TradingView Before his appearance, the billionaire entrepreneur was relentlessly tweeting Dogecoin memes, images, which helped DOGE — a cryptocurrency that started out as a joke — to attain a market capitalization north of $90 billion in May 2021. That’s more than 36,000% gains in just two years. But things have gone downhill ever since. ...
Terra back from the dead? LUNA price rises 300% in September
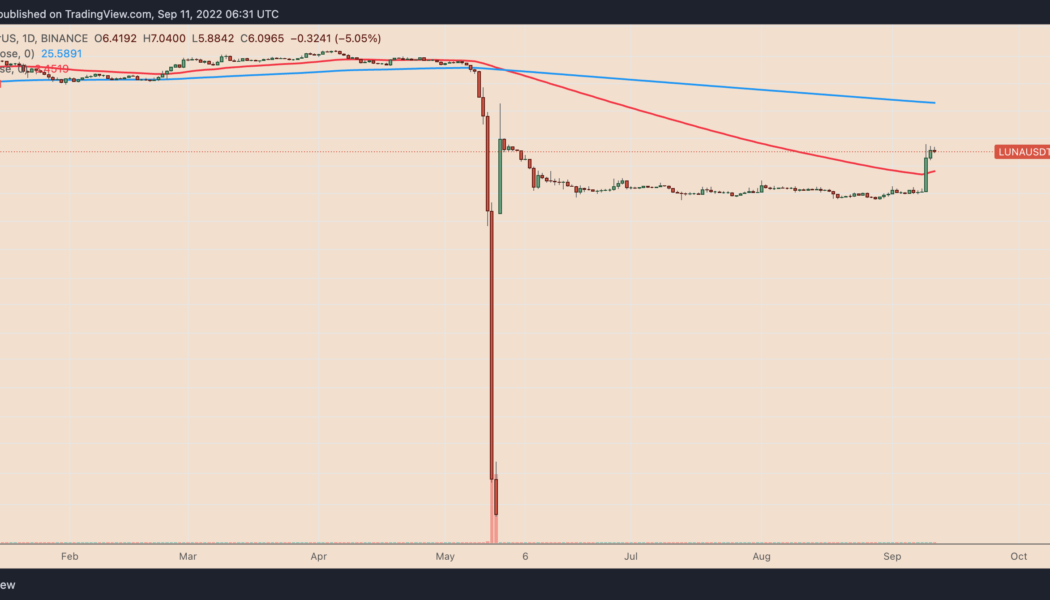
Terra has become a controversial blockchain project after the collapse of its native token LUNA and stablecoin TerraUSD (UST) in May. But its recent gains are hard to ignore for cryptocurrency traders. LUNA rising from the dead? After crashing to nearly zero in May, LUNA is now trading for around $6, a whopping 17,559,000% price rally in less than four months when measured from its lowest level. Meanwhile, LUNA’s performance in September is particularly interesting, given it has rallied by more than 300% month-to-date after a long period of sideways consolidation. LUNA/USDT daily price chart. Source: TradingView Terra ecosystem in September It is vital to note that LUNA also trades with the ticker LUNA2 across multiple exchanges. In detail, Terraform Labs, the firm behind...
Here’s why Terra Classic price has soared by 250% in September
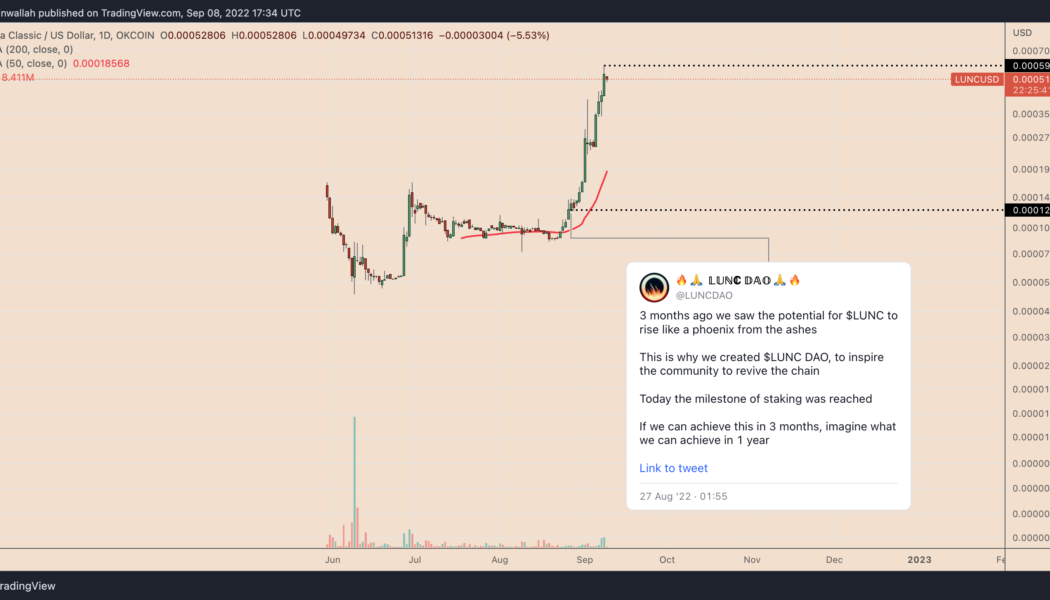
Terra Classic (LUNC) has outperformed all top-ranking cryptocurrencies so far in September gaining nearly 100% in the past seven days alone. Terra Classic outperforms crypto market The token surged more than 250% month-to-date to reach $0.000594 on Sep. 8, its best level on record. Whereas Bitcoin (BTC), dropped 4%, and Ether (ETH) gained only 3.5% in the same period. The profits in the Terra Classic market appeared despite its association with the defunct Terra (LUNA) token, a $40 billion project that collapsed in May. Terra Classic is a rebranded version of the same Terra project and thus has been the subject of skepticism from analysts and investors since its debut. But traders have ignored such warnings in recent weeks, with a flurry of fundamental catalysts influencing them to purchas...
Solana (SOL) price is poised for a potential 95% crash — Here’s why
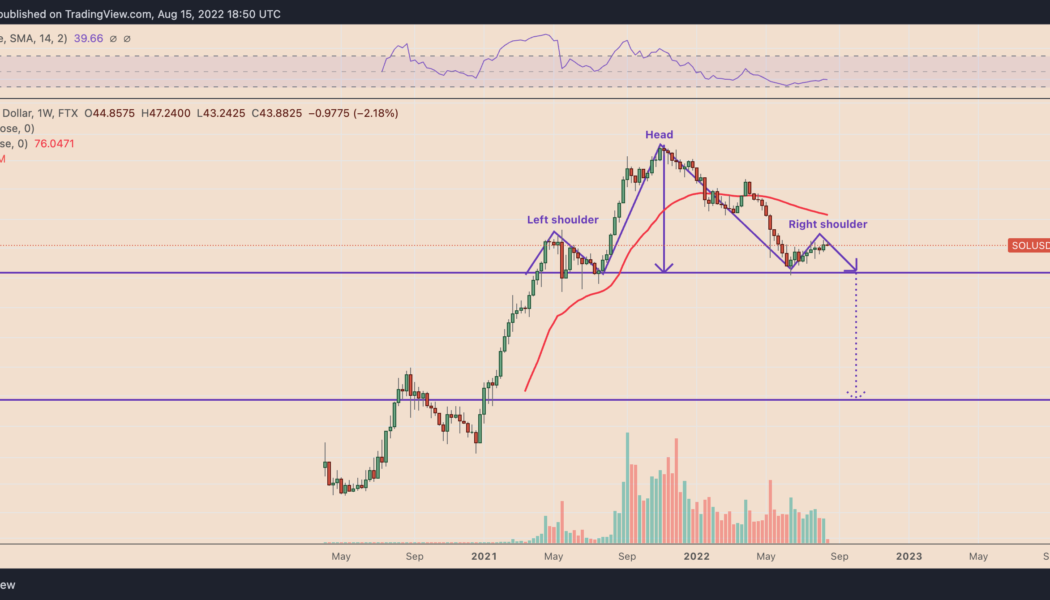
Solana (SOL) price rallied by approximately 75% two months after bottoming out locally near $25.75, but the token’s splendid upside move is at risk of a complete wipeout due to an ominous bearish technical indicator. A major SOL crash setup surfaces Dubbed a “head-and-shoulders (H&S),” the pattern appears when the price forms three consecutive peaks atop a common resistance level (called the neckline). Notably, the middle peak (head) comes to be higher than the other two shoulders, which are of almost equal height. Head and shoulders patterns resolve after the price breaks below their neckline. In doing so, the price falls by as much as the distance between the head’s peak and the neckline when measured from the breakdown point, per a rule of technical analysis....
Shiba Inu eyes 50% rally as SHIB price enters ‘cup-and-handle’ breakout mode
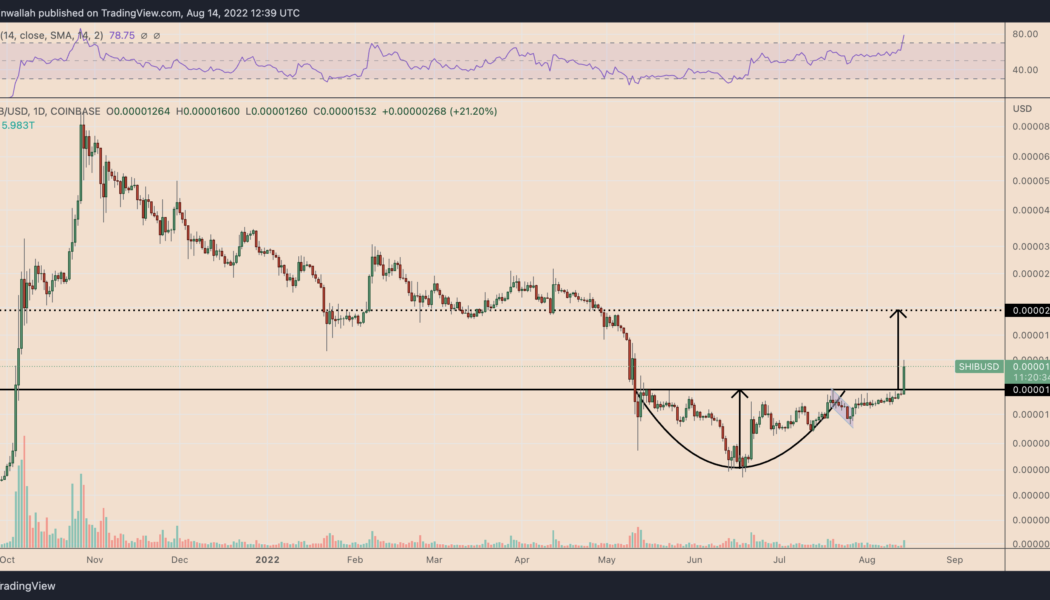
Shiba Inu (SHIB) broke out of its prevailing “cup-and-handle” pattern on Aug. 14, raising its prospects of securing additional gains in the coming weeks. Shiba Inu could soar 50% A cup-and-handle appears when the price falls and rises in a U-shaped trajectory in the first stage, followed by a swift move sideways or downward in the second. Notably, the price trend develops under a common resistance level. Typically, cup-and-handle patterns resolve after the price breaks above the resistance level; SHIB did the same on Aug. 14 after rising 27% to $0.000016, as shown below. SHIB/USD daily price chart. Source: TradingView Per the rule of technical analysis, a cup-and-handle breakout target is determined by measuring the distance between the pattern’s lowest point and resistan...
Celsius Network is bankrupt, so why is CEL price up 4,000% in two months?
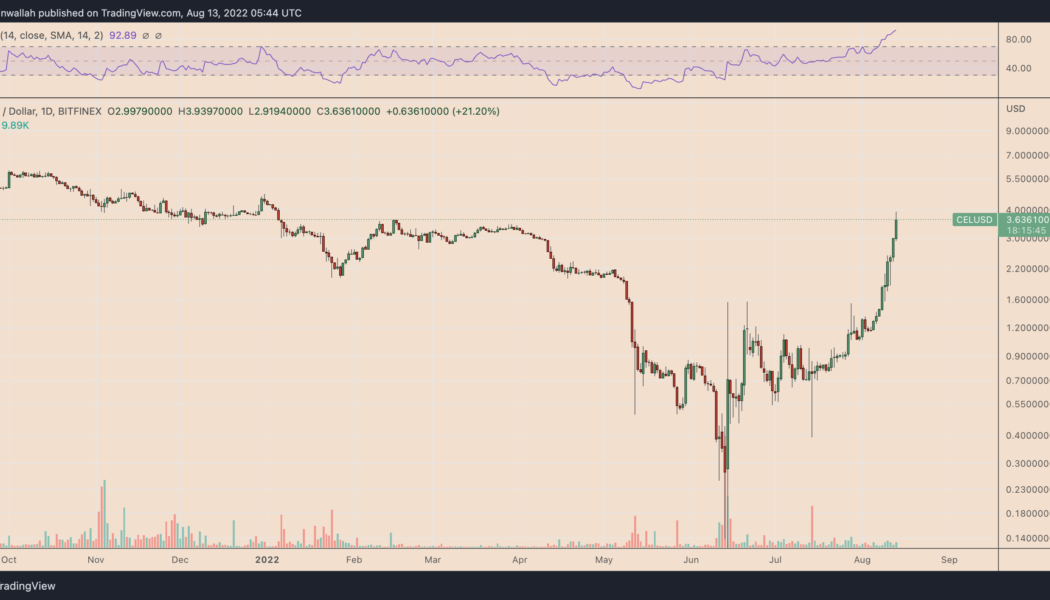
Crypto lending platform Celsius Network has an approximately $1.2 billion gap in its balance sheet, with most liabilities owed to its users. In addition, the firm has filed for bankruptcy protection, so its future looks bleak. Still, Celsius Network’s native utility token CEL has soared in valuation by over 4,100% in the last two months, reaching around $3.93 on Aug. 13 compared to its mid-June bottom of $0.093. In comparison, top coins Bitcoin (BTC) and Ether (ETH) rallied 40% and 130% in the same period. CEL/USD daily price chart. Source: TradingView Takeover rumors behind CEL explosion? Technically, the price rally made CEL an excessively valued token in early August when its relative strength index (RSI) crossed above the 70 threshold. Takeover rumors appear to be behind CEL̵...
Ominous Solana technicals hint at SOL price crashing 35% by September
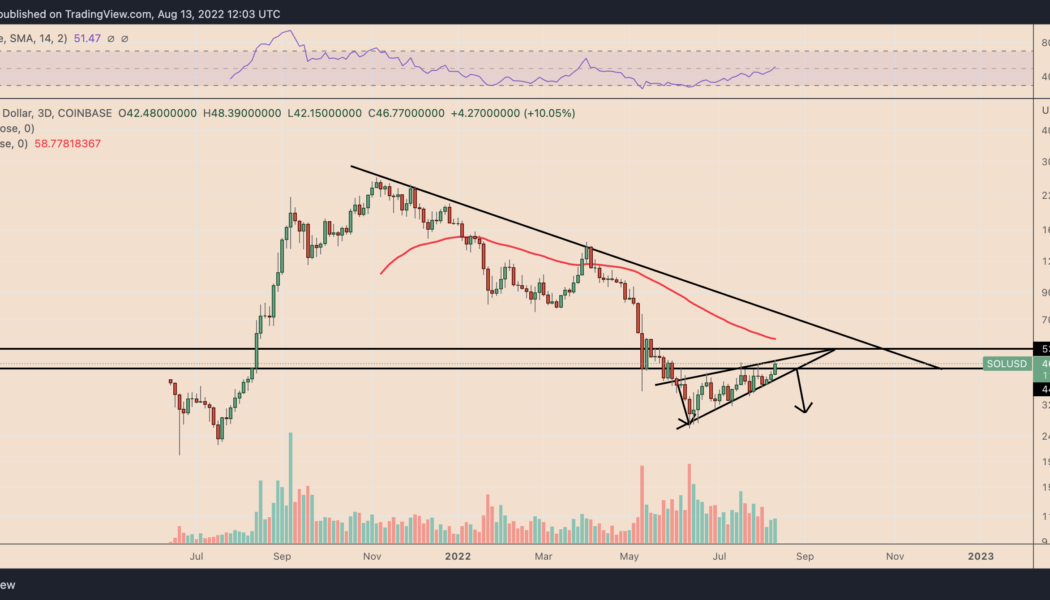
Solana (SOL) risks a significant price correction in the coming weeks owing to a classic bearish reversal setup. A 35% SOL price correction ahead? On the three-day chart, SOL’s price has been painting a rising wedge, confirmed by two ascending, converging trendlines and falling trading volumes in parallel. Rising wedges typically result in breakdown, resolving after the asset’s price break below the lower trendline. If the price follows the breakdown scenario, it could fall by as much as the maximum distance between the wedge’s upper and lower trendline. SOL is far from a breakdown but trades within a falling wedge range, as shown in the chart below. The token eyes an immediate pullback from the wedge’s upper trendline with its interim downside target sitting at the...
