A KPMG report titled “Pulse of Fintech H1 2021,” shows that the total investment in the blockchain and cryptocurrency sector in the first half of this year has risen to $8.7 billion, which is more than double the $4.3 billion worth of deals done in 2020.
KPMG global fintech co-leader Anton Ruddenklau said:
“Cryptocurrency and blockchain are exploding globally. I think for the rest of this year at least, crypto will be a very hot ticket for investors.”
Separate research by blockchain market intelligence Blockdata also shows that 55 out of the top 100 banks by assets under management have directly or through subsidiaries invested in crypto and blockchain firms.

Bittrex Global CEO Stephen Stonberg told Cointelegraph that the crypto industry has gone mainstream and is past the stage of early adoption. “What’s more interesting to see is the growth and acceleration of institutional adoption of cryptocurrencies. Almost all major institutions have invested in cryptocurrencies or plan to invest in cryptocurrencies,” Stonberg added.
Stonberg added:
“What’s more interesting to see is the growth and acceleration of institutional adoption of cryptocurrencies. Almost all major institutions have invested in cryptocurrencies or plan to invest in cryptocurrencies.”
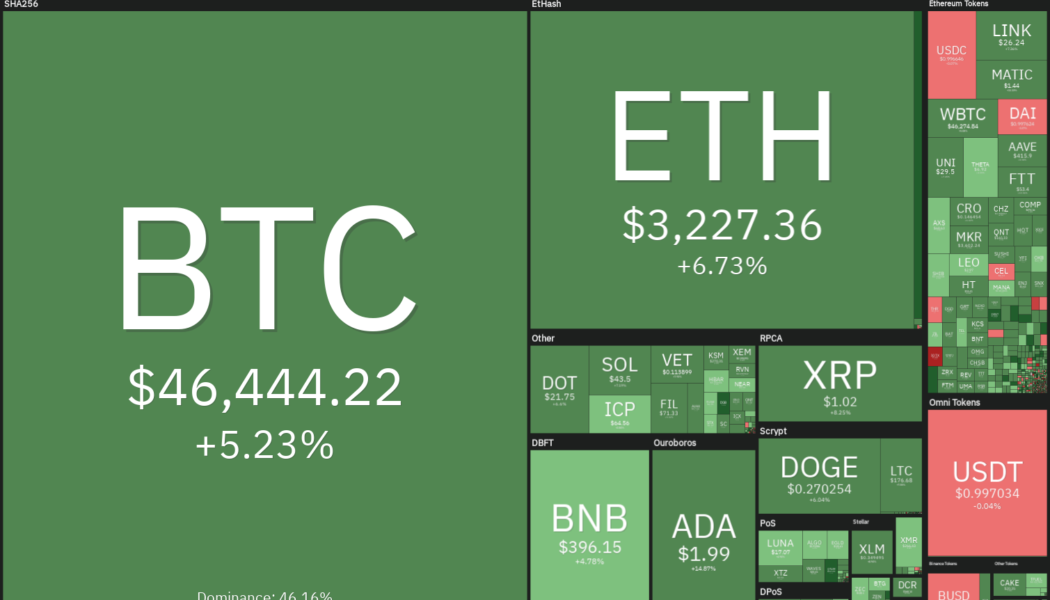
Will the strong institutional inflow into the crypto sector start the next leg of the uptrend? Let’s study the charts of the top-10 cryptocurrencies to find out.
BTC/USDT
The bears pulled Bitcoin (BTC) below the 200-day simple moving average ($45,218) on Aug 12 but they have not been able to sustain the lower levels. The bulls have pushed the price back above the 200-day SMA today, indicating buying on dips.

If buyers propel the price above the resistance line of the wedge, the BTC/USDT pair could rally to $51,500. This level may act as resistance but if bulls do not give up much ground, the uptrend may reach $60,000.
The rising 20-day exponential moving average ($41,743) and the relative strength index (RSI) just below the overbought zone suggest that bulls are in the driver’s seat.
If the price turns down from the resistance line of the wedge, the bears will smell an opportunity. The first sign of weakness will be a break and close below the 20-day EMA. Such a move could open the doors for a further decline to the critical support at $36,670.
ETH/USDT
Ether (ETH) dropped to the breakout level at $3,000 on Aug. 12 but the bears could not capitalize on the opportunity. The bulls purchased the dip and are attempting to resume the up-move today.

The upsloping 20-day EMA ($2,784) and the RSI in the overbought territory suggest that bulls have the upper hand. If buyers propel the price above $3,274, the ETH/USDT pair could rally to $3,587.06 and then to $4,000.
Contrary to this assumption, if the price turns down from $3,274, the pair may again drop to $3,000 and consolidate between these two levels for a few more days. A breakdown and close below the 20-day EMA will suggest that the bullish momentum has weakened. The pair could then drop to $2,450.
BNB/USDT
Binance Coin (BNB) formed an inside-day candlestick pattern on Aug. 12, indicating indecision among the bulls and the bears. The buyers purchased at lower levels and are currently attempting to resolve the uncertainty in their favor.

If bulls propel the price above $408.72, the up-move could reach the overhead resistance at $433. The bears may again pose a stiff challenge at this level and if the price turns down from this resistance, the pair could drop to the 20-day EMA ($347).
A strong bounce off this support will suggest that sentiment remains positive and traders are buying on dips. That will increase the possibility of a break above $433. If that happens, the BNB/USDT pair could start its journey to $520 and later to $600. The bears will have to pull the price back below $340 to gain the upper hand.
ADA/USDT
The long wick on Cardano’s (ADA) candlestick on Aug. 11 shows that bears tried to stall the rally near the overhead resistance at $1.94. That was followed by an inside-day candlestick pattern on Aug. 12 but the long tail on the day’s candlestick showed strong buying at lower levels.

The bulls have thrust the price above the overhead resistance today, which opens the gates for a rally to the all-time high at $2.47. However, the RSI has risen above 86, indicating that the rally is overextended in the short term.
Therefore, the ADA/USDT pair could witness selling at higher levels and may enter a minor correction or consolidation in the next few days. A break and close below $1.94 could result in a pullback to the 20-day EMA ($1.51).
Alternatively, if bulls defend the breakout level at $1.94, it will suggest that traders are not booking profits. That will enhance the prospects of a retest of the all-time high.
XRP/USDT
XRP broke above the downtrend line of the descending channel and surged to the overhead resistance at $1.07 on Aug. 11 but the bulls could not sustain the higher levels. The bears pulled the price back inside the channel on Aug. 12 but the correction was short lived.

The bulls have again pushed the price above the channel today and are attempting to clear the stiff hurdle at $1.07. If the price breaks and closes above $1.07, the XRP/USDT pair could start its journey to $1.26 and then to $1.70.
Contrary to this assumption, if the price turns down from $1.07, the bears will again try to pull the pair back into the channel. If they manage to do that, the next stop could be the 20-day EMA ($0.80).
If the price rebounds off the 20-day EMA, the bulls will make one more attempt to drive the pair above $1.07. Alternatively, a break and close below $0.75 will signal advantage to the bears.
DOGE/USDT
Dogecoin (DOGE) formed a Doji candlestick pattern on Aug. 12. The long wick on the day’s candlestick showed that bears are attempting to defend the overhead resistance at $0.29. Lower levels attracted buying from the bulls who are trying to propel the price above the overhead resistance today.

The rising 20-day EMA ($0.23) and the RSI near the overbought territory suggest that the path of least resistance is to the upside. A breakout and close above $0.29 could clear the path for a rally to $0.35 and then $0.45.
Conversely, if the price turns down from the overhead resistance, the DOGE/USDT pair could drop to the 20-day EMA. If the price rebounds off this level, the bulls will have another go at $0.29. A break and close below $0.21 could signal that bears are back in the game.
DOT/USDT
The bulls pushed Polkadot (DOT) above the overhead resistance at $21 on Aug. 11 but their joy was short lived as the bears pulled the price back below the level on Aug. 12.

The failure of the bears to sustain the price below $21 again attracted buying and the bulls are currently attempting to thrust the price above $22.45. If they manage to do that, the DOT/USDT pair could rally to the overhead resistance at $26.50.
The bears are likely to defend the $26.50 level aggressively as the 200-day SMA ($27.23) is placed just above it. If the bulls do not cede much ground, it will indicate that buyers are not booking profits aggressively as they anticipate the rally to continue. A breakout and close above $26.50 may signal an end of the downtrend.
On the contrary, if the price turns down from the current level and breaks below the 20-day EMA ($18.70), the pair could slide to $16.93.
UNI/USDT
Uniswap (UNI) turned down from the overhead resistance at $30 on Aug. 12 but the bears could not sink the price below the immediate support at the 200-day SMA ($26.18). This suggests that bulls are buying on dips.

The price has rebounded today and the buyers are again trying to thrust the price above the stiff overhead resistance at $30. If they can pull it off, the UNI/USDT pair could rally to $37.
If bulls arrest the subsequent decline above $30, it will increase the likelihood of a retest of the all-time high at $45. The rising 20-day EMA ($24.80) and the RSI in the overbought zone suggest that bulls are in control.
This positive view will invalidate if the price turns down from the current level and breaks below the moving averages. Such a move will signal that the pair may remain stuck inside the large range between $13 and $30 for a few more days.
Related: OpenSea trading volume explodes 76,240% YTD amid NFT boom
SOL/USDT
The long wick on Solana’s (SOL) candlestick on Aug. 11 and 12 shows that bears aggressively defended the overhead resistance at $44. However, the sellers could not pull the price below the support at $38.10, indicating buying on dips.

The bulls have again pushed the price to the overhead resistance at $44 today. A breakout and close above this level could open the gates for a rally to the psychological resistance at $50, followed by a retest of the all-time high at $58.38.
On the other hand, if the price turns down from the current level, the SOL/USDT pair could drop to the 20-day EMA ($36.77). A breakdown and close below this support will suggest that the pair could extend its stay inside the range for a few more days.
LTC/USDT
The bulls have been struggling to push Litecoin (LTC) above the overhead resistance at $180 for the past two days. This suggests that bears are attempting to stall the relief rally in the zone between $180 and the 200-day SMA ($191).

If the price turns down from this zone, the bears will try to pull the LTC/USDT pair down to the 20-day EMA ($151). A strong rebound off this support will suggest that the sentiment remains positive. A breakout and close above the 200-day SMA will signal that the downtrend may have ended.
The pair could then rally to $225 where the bears may again pose a stiff challenge. After that, if bulls flip the 200-day SMA to support, it will indicate the start of a new uptrend. This positive view will invalidate if the price turns down and breaks below $150.
The views and opinions expressed here are solely those of the author and do not necessarily reflect the views of Cointelegraph. Every investment and trading move involves risk. You should conduct your own research when making a decision.
Market data is provided by HitBTC exchange.


