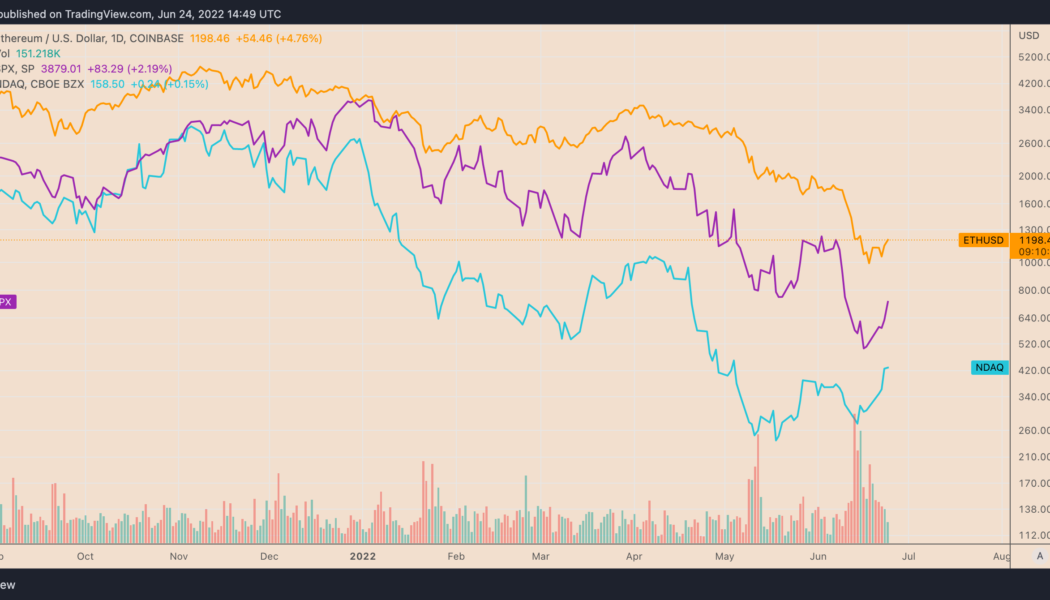
Ethereum’s native token, Ether (ETH), gained alongside riskier assets as investors assessed weak U.S. economic data and its potential to cool down rate hike fears.
Ether mirrors risk-on recovery
ETH’s price climbed up to 8.31% on June 24 to $1,225, six days after falling below $880, its lowest level since January 2021.
Overall, the upside retracement brought bulls 40% in gains, raising anticipation about an extended recovery in the future while alleviating fears of a “clean fakeout.”
For instance, independent market analyst “PostyXBT” projected ETH’s price to close above $1,300 by the end of June.
In contrast, analyst “Wolf” feared that bears would attempt to “push price back to $1,047,” albeit anticipating a run-up toward $1,250 if ETH holds above its diagonal trendline support, as shown below.
$ETH 4h.
If the trend change is real, then we will soon find out. Bulls must hold this diagonal and see this type of scenario.
Bears, instead will try to push price back to 1047 pic.twitter.com/PRG9fD4iRz— Wolf (@IamCryptoWolf) June 21, 2022
Ether has come under pressure from the Federal Reserve’s hawkish policy in 2022. But those fears appear to be subsiding after the latest U.S. composite purchasing managers report, which shows the manufacturing activity fell to a five-month-low.
“Growth is coming down, maybe even sooner than expected,” Esty Dwek, chief investment officer at FlowBank, told the Wall Street Journal, adding:
“That should allow the Fed to soften at some point.”

Still, Greg Peters, co-chief investment officer at PGIM Fixed Income, warned that the current rally in the risk-on markets might not last. He is unconvinced that “the central banks will stop tightening if economies slow.”
Classic bullish reversal setup in play
Ether’s rebound on June 24 also had it break above a falling resistance trendline that constitutes an “inverse head-and-shoulders” pattern (IH&S).
In detail, Ether has formed the IH&S pattern after forming three troughs below a common support level, called the neckline. Also, the middle trough comes out to be deeper than the other two, which are more or less of the same height.
Related: ‘Foolish’ to deny Bitcoin price can go under $10K — Analysis
Traditional analysts see IH&S as a bullish reversal setup, i.e., they resolve after the price breaks above their neckline support. As a rule, the price could rise by as much as the IH&S’s maximum height after the breakout.

As a result, Ether eyes an extended upside retracement toward $1,560 after breaking above its IH&S neckline, up nearly 33% from the current price. Interestingly, the IH&S profit target coincides with ETH’s 200-4H exponential moving average (200-4H EMA; the blue wave) near $1,537.
The views and opinions expressed here are solely those of the author and do not necessarily reflect the views of Cointelegraph.com. Every investment and trading move involves risk, you should conduct your own research when making a decision.
 [flexi-common-toolbar] [flexi-form class=”flexi_form_style” title=”Submit to Flexi” name=”my_form” ajax=”true”][flexi-form-tag type=”post_title” class=”fl-input” title=”Title” value=”” required=”true”][flexi-form-tag type=”category” title=”Select category”][flexi-form-tag type=”tag” title=”Insert tag”][flexi-form-tag type=”article” class=”fl-textarea” title=”Description” ][flexi-form-tag type=”file” title=”Select file” required=”true”][flexi-form-tag type=”submit” name=”submit” value=”Submit Now”] [/flexi-form]


Tagged: crypto blog, Crypto news, Economy, ETH Price, Ether Price, Ethereum, Federal Reserve, Inflation, Interest Rate, Investment, Manufacturing, Trading, U.S. GDP