The cryptocurrency market is ending the week positively after a few coins touched new all-time highs while some recovered from earlier losses
Of the three cryptocurrencies reviewed here, SafeMoon is the only one that had a terrible week, losing more than 10% of its value in the process. Heading into the weekend, the prices of these cryptocurrencies are retracing, and more negative corrections could be experienced in the coming hours and days.
Ethereum price outlook
The ETH/USD 4-hour chart is still in bullish territory following the cryptocurrency’s excellent performance. Over the next few hours, ETH will need to steer clear of the $3,783 pivot if it stands a chance of surpassing Thursday’s high of $3,838.28.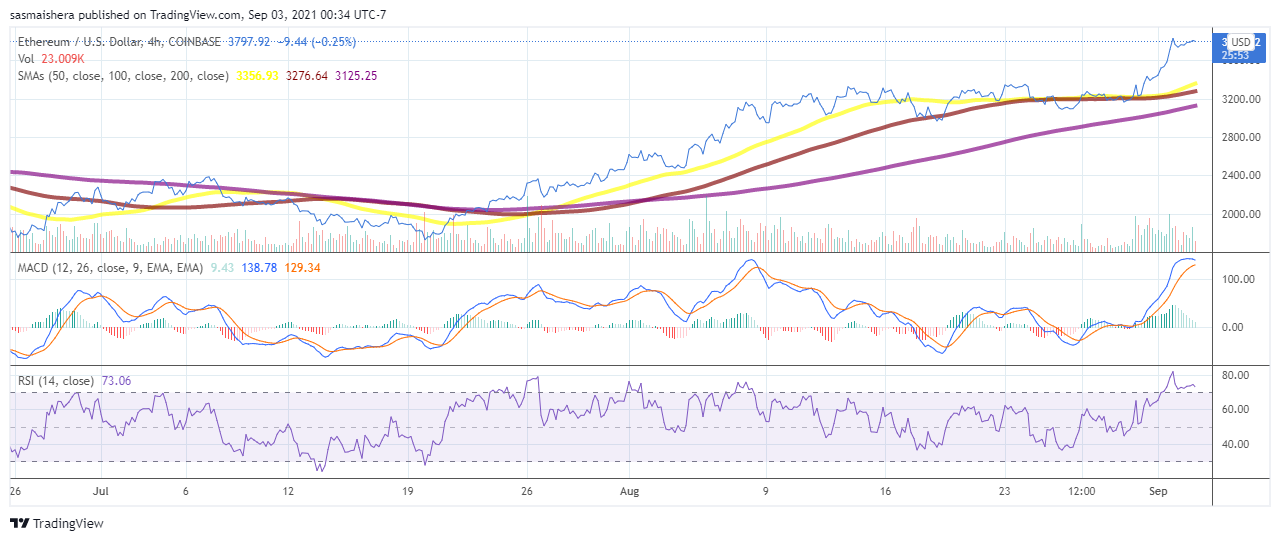 ETH/USD 4-hour chart. Source: TradingView
In the event of a market rally over the next few hours or days, Ether looks primed to test the second resistance level at $3,899 and another resistance point at $4,000. However, failure to capitalise on its latest win could see ETH drop below the first major support level at $3,728. Unless there is an extended period of sell-off in the market, Ether should comfortably stay above sub-$3,500 levels.
Check out our Ethereum buy page here
BNB price outlook
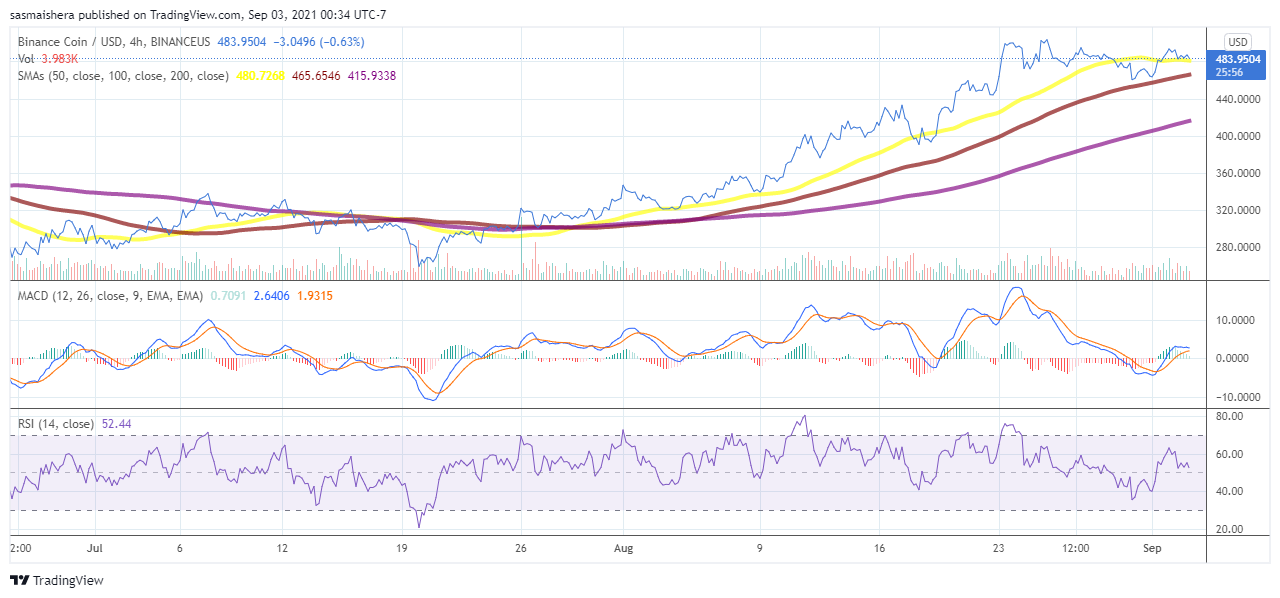
BNB is the second coin in our coverage that has recorded a net positive week. The BNB/USD 4-hour chart is heading into bearish territory after the coin lost more than 1% of its value in the past few hours. The RSI of 47 means that BNB is heading into the oversold territory while its MACD line is closing in on the bearish region.
BNB/USD 4-hour chart. Source: TradingView
If the declining trend continues, BNB could slip below the first resistance point at $465, erasing the gains it obtained over the past week. The second major resistance point at $443 should cap further downward movement unless there is an extended sell-off period in the market.
Check out our Binance Coin buy page here
SafeMoon price outlook
SafeMoon was the worst performer amongst the three cryptocurrencies, losing roughly 10% of its value in the last week. The major technical indicators, the RSI and the MACD, are already in bearish territory, and SAFEMOON could record further losses over the weekend.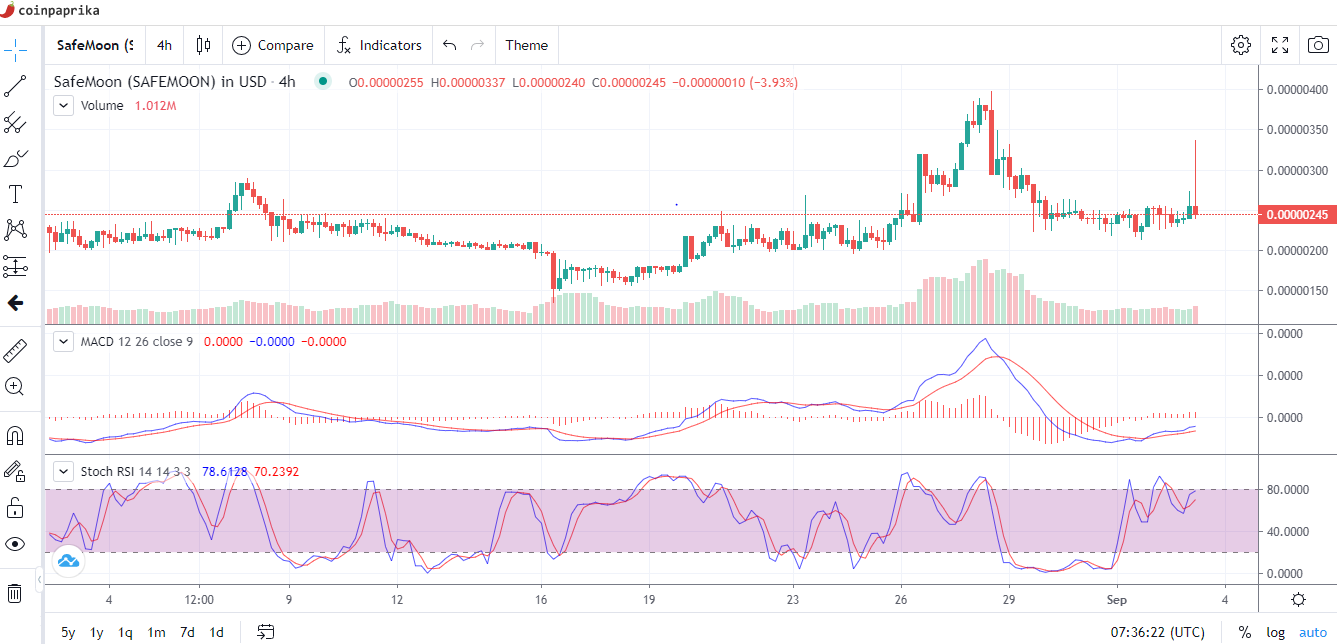
SAFEMOON/USD 4-hour chart. Source: Coinpaprika
If the bearish trend continues, SAFEMOON could drop below the crucial support line at $0.00000215. Further downward movement in the market could see SAFEMOON trade below $0.00000200 for the first time in two weeks.
However, if the bulls take control of the market, SAFEMOON could rally towards the $0.00000270 resistance level. An extended market rally could push SAFEMOON above the $0.00000313 level.
