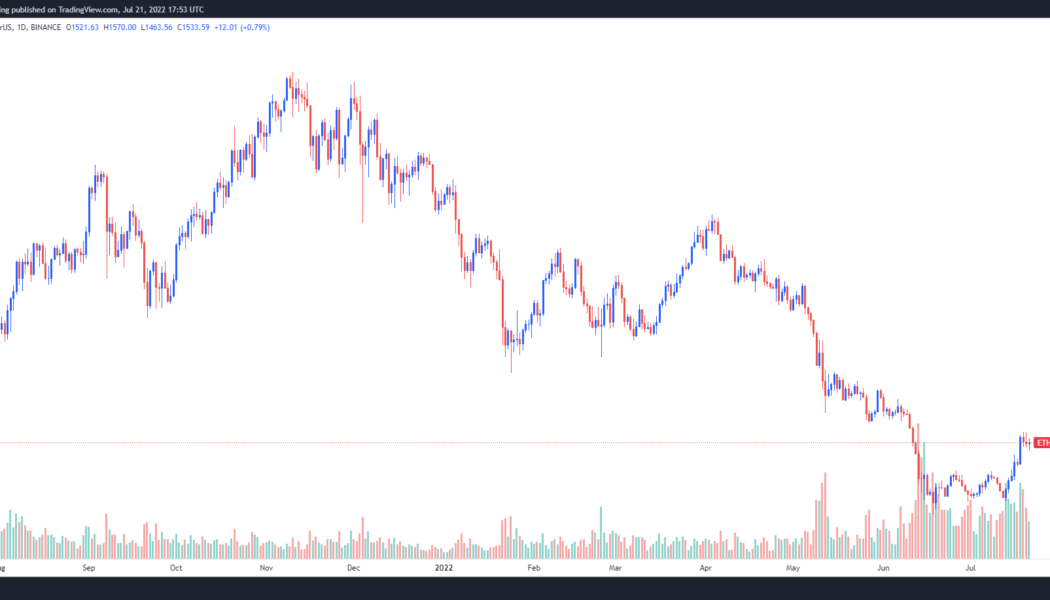
Price action across the cryptocurrency market was largely subdued on July 21, as traders took a day to digest gains over the past week and book profits following the biggest relief rally since early June.
Amid speculation about what drove the recent rally, the Ethereum Merge has consistently ranked at the top of the list. The market rally shifted into high gear after a tentative date of Sept. 19 was set for the mainnet Merge.
Data from Cointelegraph Markets Pro and TradingView shows that after hitting a high of $1,620 on July 20, Ether’s (ETH) price retraced to a low of $1,463 in the early trading hours on July 21 and has since climbed back above support at $1,500.

Now that the initial price surge brought on by the Merge announcement has subsided, here’s what several analysts are expecting to unfold as Ether’s mainnet transition to proof-of-stake approaches.
A healthy pullback
Ether’s pullback on July 21 is a positive development according to market analyst Rekt Capital, who posted the following chart highlighting the importance of its weekly close above $1,300 and subsequent move higher.

Rekt Captial said:
“Though #ETH could just continue higher to reach the upper orange region, it would be healthier for ETH to dip. Such a retest of the lower orange area would only increase probability of continuation.”
July 21’s pullback aligns with this outlook and suggests the possibility of a move up to $1,700 in the near future.
Watch out for a sharp drop to $1,200
Ether’s modest retrace was also an anticipated development by crypto trader and pseudonymous Twitter user Team Lambo, who provided the following chart showing the clear rejection at $1,630 and 10% retracement.

Team Lambo explained in a Twitter post:
“Now the bigger correction will come below $1,440 and almost certainly will see a sharp drop towards $1,200 so keep on waiting for that move for #Ethereum.
Related: What are the long-term goals for the Ethereum blockchain? Vitalik Buterin explains live at EthCC
Lower highs and higher lows
A more nuanced analysis of the recent price action for Ether was offered by market analyst CryptoLinns, who posted the following chart noting that the move on July 20 did not set a new high while the drop on July 21 did not establish a new low on the 4-hour chart.

CryptoLinns said,
“The last candle showed a long lower shadow line, which proves demand appeared. But volume is not enough. Watch out whether the demand of this candle now is persistent.”
According to CryptoLinns, the current support level is located at $1,450 while overhead resistance is found at $1,630.
A final bit of insight into the critical levels to watch on the Ethereum chart was provided by crypto trader Altcoin Sherpa, who posted the following chart identifying lower levels of support at $1,012 and $1,281 and overhead resistance at $1,701, $2,145 and $2,465.

The overall cryptocurrency market cap now stands at $1.039 trillion and Ether’s dominance rate is 18%.
The views and opinions expressed here are solely those of the author and do not necessarily reflect the views of Cointelegraph.com. Every investment and trading move involves risk, you should conduct your own research when making a decision.
 [flexi-common-toolbar] [flexi-form class=”flexi_form_style” title=”Submit to Flexi” name=”my_form” ajax=”true”][flexi-form-tag type=”post_title” class=”fl-input” title=”Title” value=”” required=”true”][flexi-form-tag type=”category” title=”Select category”][flexi-form-tag type=”tag” title=”Insert tag”][flexi-form-tag type=”article” class=”fl-textarea” title=”Description” ][flexi-form-tag type=”file” title=”Select file” required=”true”][flexi-form-tag type=”submit” name=”submit” value=”Submit Now”] [/flexi-form]


Tagged: crypto blog, Crypto news, cryptocurrencies, Ether Price, Ethereum 2.0, Ethereum Price, Market Update, Markets