Bitcoin (BTC) has dipped below $60,000 — but BTC price action is still mimicking the eye-popping 2017 bull run.
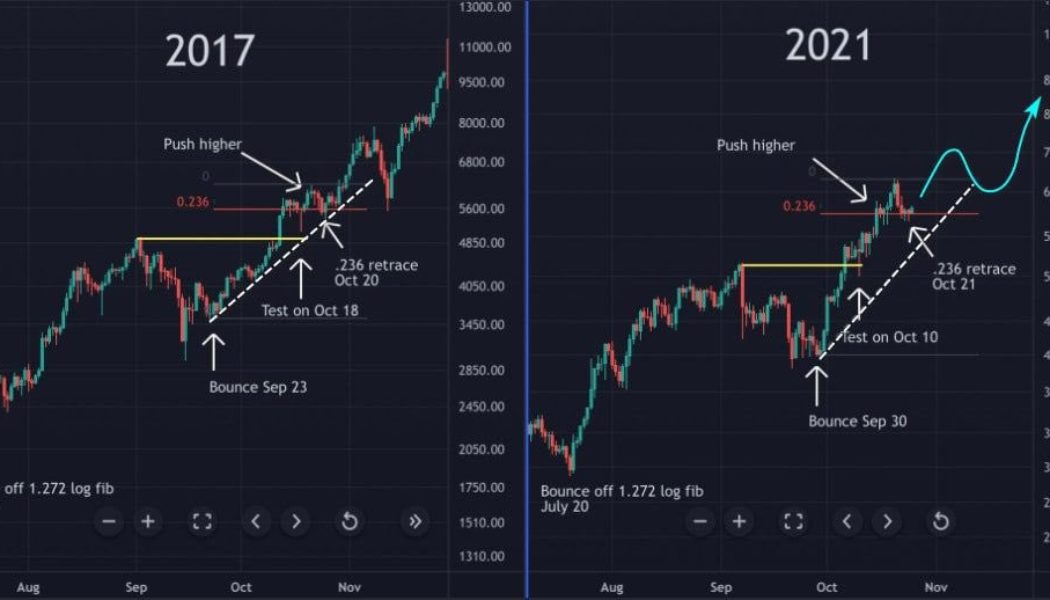
The latest data covering Bitcoin’s current halving cycle versus its previous one shows just how similar 2017 and 2021 really are.
Bitcoin prints more eerie 2017similarities
Bitcoin has had its ups and downs this year, but as Cointelegraph reported, BTC/USD has all but copy-pasted its 2017 fractal all along.
Fresh analysis delivers the same conclusion — and for those concerned about Oct. 27’s drop to $58,000, even this is nothing new.
Astonishingly, the dates of price phenomena in September and October 2021 practically match 2017. Popular Twitter account Smart Crypto, which noticed the trend, called for an “explosion” in time for 2022.

Utilizing Fibonacci sequences, should the rest of the quarter follow the same timeline as four years ago, significantly higher prices are in store for Bitcoin. Being an order of magnitude higher than the 2017 peak, these prices could hit $300,000.
Trader bets on a deeper BTC price correction
In the short term, however, those overly long on BTC may face some serious pain, analysts warn.
Related: Bitcoin drops $1K in five minutes in fresh dip below $60K
Filbfilb, the trader who forecast a potential drop to $50,000 this week, reiterated on Oct. 27 that even $57,000 looks to be unreliable as a potential local price floor.
Support sir?
Not unless your *friends* at bybit stop buying.
Expecting Yikes to be initiated. pic.twitter.com/H5nc6lVDfx
— filbfilb (@filbfilb) October 27, 2021
Funding rates continued to decrease as BTC/USD hovered at around $59,000 prior to the United States market opening.


