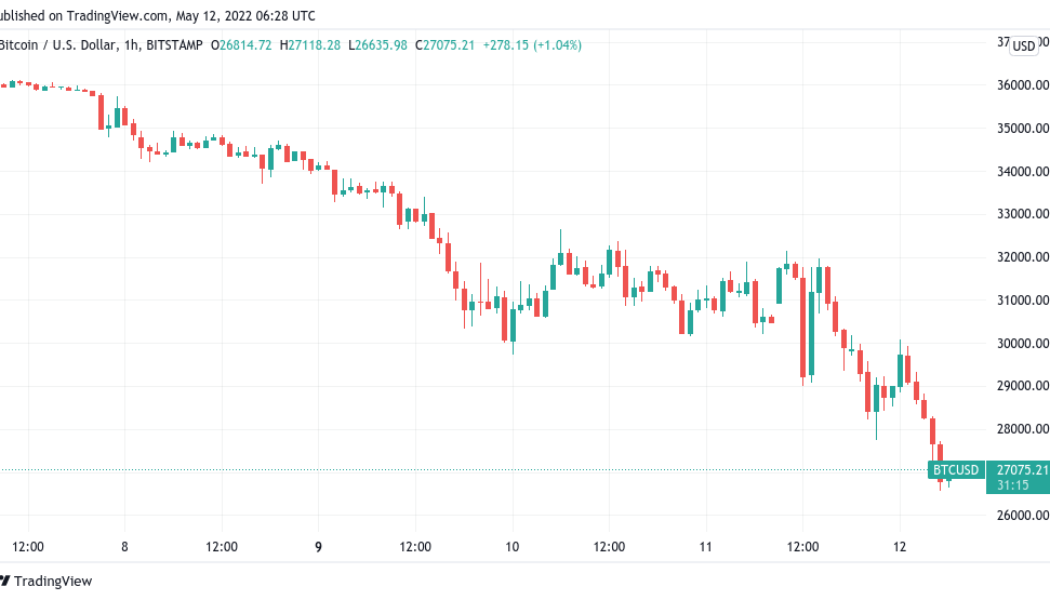
Bitcoin (BTC) fell out of its long-term trading range on May 12 as ongoing sell pressure reduced markets to 2020 levels.

Tether wobbles as UST stays under $0.60
Data from Cointelegraph Markets Pro and TradingView followed BTC/USD as it exited the range in which it had traded since the start of 2021.
At the time of writing, the pair circled $26,700 on Bitstamp, marking its lowest since Dec 28, 2020.
The weakness came as fallout from the Terra stablecoin meltdown continued to ricochet around crypto and beyond, with rumors claiming that even professional funds were experiencing solvency issues due to losses on LUNA and UST.
“People are still processing this but this is the Lehman moment for crypto”
Hearing about a lot of funds possibly insolvent from Luna meltdown
— Frank Chaparro (@fintechfrank) May 12, 2022
LUNA, Tether’s in-house token, had all but capitulated in value at the time of writing, trading at around $0.22. At the start of May, LUNA/USD traded at $80.

UST, currently the focus of Terra executives committed to restoring its U.S. dollar peg, was at around $0.60, still far from $1 but more than double the week’s record lows.

Nevertheless, the strain was increasingly visible across crypto, as largest stablecoin Tether (USDT) itself began to deliver worrying signs that it was copying UST’s downfall.
At the time of writing, USDT/USD was under $0.99 on major exchanges.
Commenting on system stability, Tether chief technology officer Paolo Ardoino said that withdrawals of USDT were proceeding as normal.
“>300M redeemed in last 24h without a sweat drop,” part of a tweet read.

Data from on-chain analytics firm CryptoQuant added that record outflows of stablecoins had been witnessed on major exchanges.

$1.22 billion liquidated in 24 hours
On the topic of losing the macro range low created in January 2021, analysts were still willing to see current levels as a potential opportunity.
Related: Ethereum whales get busy as transactions hit highest point since January
“Whatever you lose in a macro downtrend, you’ll gain multiples back in a macro uptrend. All you have to do is pay attention to the markets when they are ultra bearish,” popular trader Rekt Capital argued.
A previous tweet on May 11 highlighted the macro range.
If #BTC loses this green area as support…
That will be the confirmation that $BTC will enter a multi-month downtrend#Crypto #Bitcoin pic.twitter.com/ReIa6D4yw3
— Rekt Capital (@rektcapital) May 11, 2022
The extent of the losses was reflected in market liquidations. Data from on-chain monitoring resource Coinglass showed that for Bitcoin and altcoins combined, these topped $1.2 billion in the 24 hours to the time of writing.
The views and opinions expressed here are solely those of the author and do not necessarily reflect the views of Cointelegraph.com. Every investment and trading move involves risk, you should conduct your own research when making a decision.
 [flexi-common-toolbar] [flexi-form class=”flexi_form_style” title=”Submit to Flexi” name=”my_form” ajax=”true”][flexi-form-tag type=”post_title” class=”fl-input” title=”Title” value=”” required=”true”][flexi-form-tag type=”category” title=”Select category”][flexi-form-tag type=”tag” title=”Insert tag”][flexi-form-tag type=”article” class=”fl-textarea” title=”Description” ][flexi-form-tag type=”file” title=”Select file” required=”true”][flexi-form-tag type=”submit” name=”submit” value=”Submit Now”] [/flexi-form]


Tagged: Bitcoin, BTC price, crypto blog, Crypto news, LUNA Price, Stablecoin, Terra, Tether, USDT, ust