REVEALED: The ten best and worst states in the U.S. if you want to live a long and healthy life… and California didn’t even make the top five
- There is a strong correlation between lifestyle and life expectancy, study finds
- Federal data on overall healthiness was compared with life expectancy by state
- West Virginia, Mississippi, Alabama ranked Louisiana ranked last for both
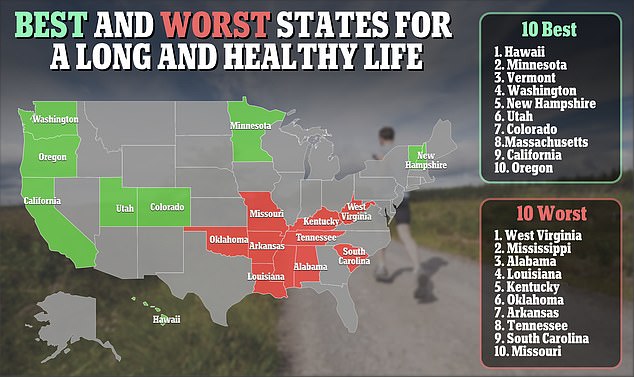
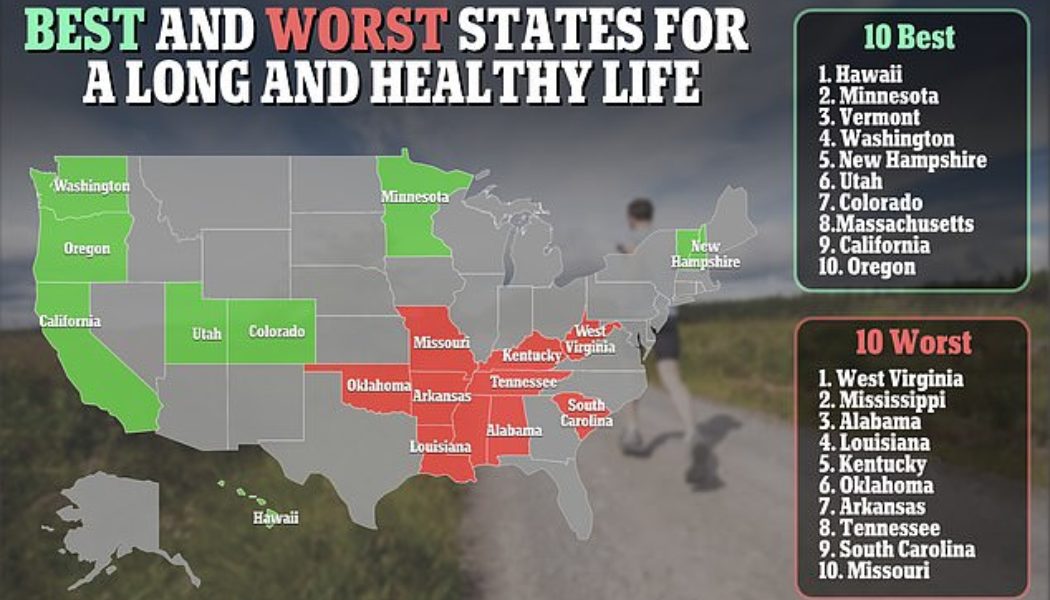
The ten best and worst states in the US for a combination of both a long and healthy life have been revealed and California was not among the top five.
Hawaii was rated the highest overall for those seeking a healthy lifestyle and high life expectancy, followed by Minnesota, Vermont, Washington and New Hampshire.
Similarly, states with the lowest life expectancy tended to be the states with the least healthy lifestyles and were mainly in the southeast. West Virginia was ranked last overall, followed by Mississippi, Alabama, Louisiana and Kentucky.
Notably, California did not even make the top five most healthy states, ranking 14 for healthy lifestyle, but it tied fifth with Massachusetts and New Hampshire for life expectancy.
‘Life expectancy’ is determined by a number of factors, including healthcare and murder rates, but a study carried out by biomedical research and longevity society, Life Extension, suggests general healthiness plays a major role too.


The study analyzed federal data of eight measures of healthiness to determine which states have the healthiest lifestyles, and compared that to their actual life expectancies.
The overall healthy lifestyle ranking was informed by federal data measuring the following: amounts of exercise, proximity to parks and schools, fruit and vegetable consumption, hours of sleep, body weight, number of single people, anxiety levels and state expenditure on outdoor recreation.
Although it found there was a strong correlation between healthy lifestyles and life expectancy, there were also some exceptions.
Outliers include DC and Montana, where life expectancies were low despite the fact they appeared to have healthy lifestyles.
In general, DC’s low life expectancy was explained by racial disparities and a high incidence of heart disease, cancer and homicide, according to the Life Extension study. DC is also a city and not a state, so it often appears off when considering state-wide data.


On the other hand, Connecticut and New York had higher life expectancies given the relatively unhealthy lifestyles of their inhabitants.
Montana, Alaska and North Carolina had generally good health habits but only average life expectancies.
Lower life expectancy in poorer states has also been blamed on worse healthcare systems and more residents without health insurance.
However, those states also have higher rates of chronic diseases – such as obesity – raising the risk of a myriad of other conditions such as heart disease and high blood pressure later in life.
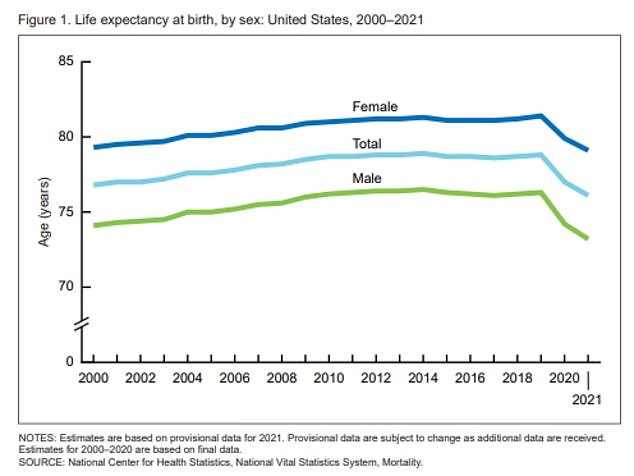
America’s life expectancy was 79 years and a month in 2020, according to data from the National Vital Statistics System.
Last year marked second year on record that it had declined, and an almost two-year downturn from 2019. Every single state registered a decline in life expectancy between 2019 and 2020.
New York – which was hit especially bad during the first year of Covid – saw the largest decline, falling almost three years.
| State | Overall ranking | Life expectancy | Healthy lifestyle ranking |
|---|---|---|---|
| Hawaii | 1 | 80.7 | 4 |
| Minnesota | 2 | 79.1 | 5 |
| Vermont | 2 | 78.8 | 1 |
| Washington | 4 | 79.2 | 8 |
| New Hampshire | 5 | 79 | 7 |
| Utah | 6 | 78.6 | 3 |
| Colorado | 7 | 78.3 | 2 |
| Massachusetts | 8 | 79 | 11 |
| California | 9 | 79 | 14 |
| Oregon | 10 | 78.8 | 12 |
| Idaho | 11 | 78.4 | 10 |
| Wisconsin | 12 | 77.7 | 13 |
| Rhode Island | 13 | 78.2 | 17 |
| Montana | 14 | 76.8 | 9 |
| Connecticut | 15 | 78.4 | 23 |
| New Jersey | 16 | 77.5 | 15 |
| Maine | 17 | 77.8 | 21 |
| New York | 18 | 77.7 | 25 |
| Florida | 19 | 77.5 | 22 |
| Maryland | 19 | 76.8 | 18 |
| Illinois | 21 | 76.8 | 19 |
| Nebraska | 22 | 77.7 | 28 |
| D.C. | 23 | 75.3 | 6 |
| Virginia | 24 | 77.6 | 27 |
| Alaska | 24 | 76.6 | 16 |
| lowa | 27 | 77.5 | 35 |
| North Carolina | 28 | 76.1 | 20 |
| Delaware | 29 | 76.7 | 29 |
| Wyoming | 29 | 76.3 | 24 |
| Pennsylvania | 31 | 76.8 | 34 |
| North Dakota | 32 | 76.9 | 38 |
| Kansas | 33 | 76.4 | 33 |
| Arizona | 33 | 76.3 | 32 |
| Michigan | 35 | 76 | 30 |
| Nevada | 36 | 76.3 | 36 |
| Texas | 37 | 76.5 | 40 |
| Georgia | 38 | 75.6 | 37 |
| New Mexico | 38 | 74.5 | 31 |
| Ohio | 40 | 75.3 | 42 |
| Indiana | 40 | 75 | 39 |
| Missouri | 42 | 75.1 | 41 |
| South Carolina | 43 | 74.8 | 43 |
| Tennessee | 44 | 73.8 | 44 |
| Oklahoma | 45 | 74.1 | 46 |
| Arkansas | 45 | 73.8 | 45 |
| Kentucky | 47 | 73.5 | 47 |
| Louisiana | 48 | 73.1 | 48 |
| Alabama | 49 | 73.2 | 50 |
| Mississippi | 50 | 71.9 | 49 |
| West Virginia | 51 | 72.8 | 51 |


