For bulls, Bitcoin’s (BTC) daily price action leaves a lot to be desired, and at the moment, there are few signs of an imminent turnaround.
Following the trend of the past six or more months, the current factors continue to place pressure on BTC price:
- Persistent concerns of potential stringent crypto regulation.
- United States Federal Reserve policy, interest rate hikes and quantitative tightening.
- Geopolitical concerns related to Russia, Ukraine and the weaponization of high-demand natural resources imported by the European Union.
- Strong risk-off sentiment due to the possibility of a U.S. and global recession.
When combined, these challenges have made high volatility assets less than interesting to institutional investors, and the euphoria seen during the 2021 bull market has largely dissipated.
So, day-to-day price action is not encouraging, but looking at longer duration metrics that gauge Bitcoin’s price, investor sentiment and perceptions of valuation do present some interesting data points.
The market still flirts with oversold conditions
On the daily and weekly timeframe, BTC’s price is pressing against a long-term descending trendline. At the same time, the Bollinger Bands, a simple momentum indicator that reflects two standard deviations above and below a simple moving average, are beginning to constrict.
Tightening in the bands usually occurs before a directional move, and price trading at long-term resistance is also typically indicative of a strong directional move.
Bitcoin’s sell-off from March 28 to June 13 sent its relative strength index (RSI) to a multi-year record low, and a quick glance at the indicator compared against BTC’s longer-term price action shows that buying when the RSI is deeply oversold is a profitable strategy.

While the short-term situation is dire, a price agnostic view of Bitcoin and its market structure would suggest that now is an opportune moment to accumulate.
Now, let’s contrast Bitcoin’s multi-year price action over the RSI to see if any interesting dynamics emerge.

In my opinion, the chart speaks for itself. Of course, further downside could occur, and various technical and on-chain analysis indicators have yet to confirm a market bottom.
Some analysts have forecast a drop to the $15,000–$10,000 range, and it’s possible that the buy wall at $18,000 is absorbed and turns into a bull trap. Aside from that event, increasing position size at the occurrence of an oversold weekly RSI has yielded positive results for those brave enough to take a swing.
Another interesting metric to view in the longer timeframe is the moving average convergence divergence (MACD) oscillator. Like the RSI, the MACD became deeply oversold as Bitcoin’s price collapsed to $17,600, and while the MACD (blue) has crossed above the signal line (orange), we can see that it still lingers in previously untested territory.

The histogram has turned positive, which some traders interpret as an early trend reversal sign, but given all the macro challenges facing crypto, it should not be heavily relied upon in this instance.
What I find interesting is that while Bitcoin’s price is painting lower highs and lower lows on the weekly chart, the RSI and MACD are moving in the opposite direction. This is known as a bullish divergence.

From the vantage point of technical analysis, the confluence of multiple indicators suggests that Bitcoin is undervalued. Now, with that said, the bottom does not appear to be in, given that a bevy of non-crypto-specific issues continues to inject weakness into BTC’s price and the wider market. A drop to $10,000 is another 48% slide from BTC’s current valuation near $20,000.
Let’s take a look at what the on-chain data is showing at the moment.
MVRV Z-Score
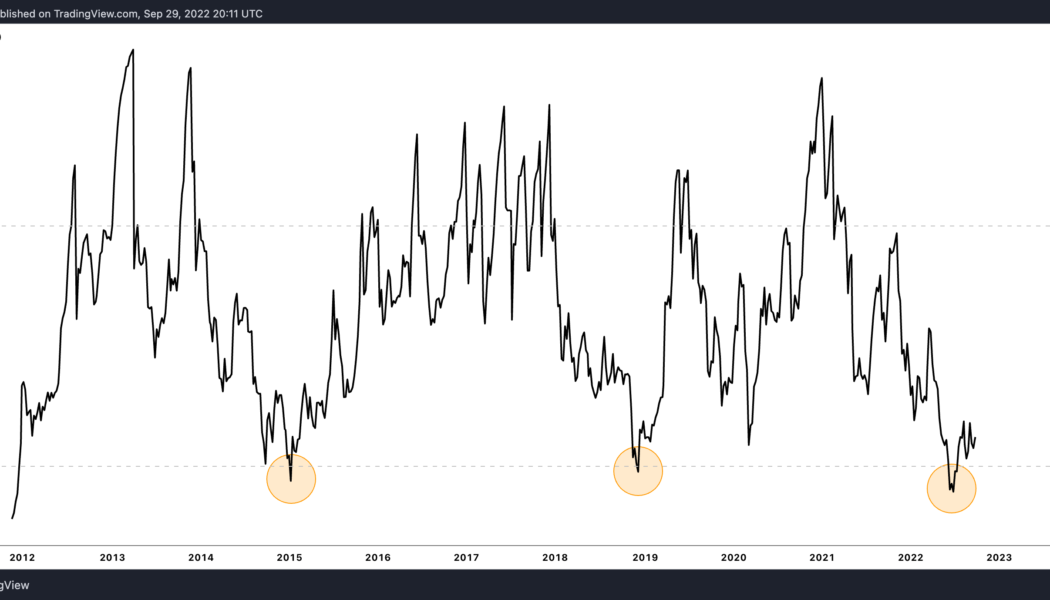
The MVRV Z-Score is an on-chain metric that reflects a ratio of BTC’s market capitalization against its realized capitalization (the amount people paid for BTC compared to its value today).
According to co-creator David Puell:
“This metric clearly displays the peaks and busts of the price cycle, emphasizing the oscillation between fear and greed. The brilliance of realized value is that it subdues ‘the emotions of the crowds’ by a significant degree.”
Basically, if Bitcoin’s market value is measurably higher than its realized value, the metric enters the red area, indicating a possible market top. When the metric enters the green zone, it signals that Bitcoin’s current value is below its realized price and that the market could be nearing a bottom.

Looking at the chart, when compared against Bitcoin’s price, the current 0.127 MVRV Z-Score is in the same range as previous multi-year lows and cycle bottoms. Comparing the on-chain data against the technical analysis indicators mentioned earlier again suggests that BTC is undervalued and in an optimal zone for building a long position.
Related: Bitcoin price slips under $19K as official data confirms US recession
Reserve Risk
Another on-chain data point showing interesting data is the Reserve Risk metric. Created by Hans Hauge, the chart provides a visual of how “confident” Bitcoin investors are contrasted against the spot price of BTC.
As shown on the chart below, when investor confidence is high, but BTC price is low, the risk to reward or Bitcoin attractiveness versus the risk of buying and holding BTC enters the green area.
During times when investor confidence is low, but the price is high, Reserve Risk moves into the red area. According to historical data, building a Bitcoin position when Reserve Risk enters the green zone has been a good time to establish a position.

As of Sept. 30, data from LookIntoBitcoin and Glassnode both show Reserve Risk trading at its lowest measurement ever and outside the boundaries of the green zone.
This newsletter was written by Big Smokey, the author of The Humble Pontificator Substack and resident newsletter author at Cointelegraph. Each Friday, Big Smokey will write market insights, trending how-tos, analyses and early-bird research on potential emerging trends within the crypto market.
The views and opinions expressed here are solely those of the author and do not necessarily reflect the views of Cointelegraph.com. Every investment and trading move involves risk, you should conduct your own research when making a decision.
 [flexi-common-toolbar] [flexi-form class=”flexi_form_style” title=”Submit to Flexi” name=”my_form” ajax=”true”][flexi-form-tag type=”post_title” class=”fl-input” title=”Title” value=”” required=”true”][flexi-form-tag type=”category” title=”Select category”][flexi-form-tag type=”tag” title=”Insert tag”][flexi-form-tag type=”article” class=”fl-textarea” title=”Description” ][flexi-form-tag type=”file” title=”Select file” required=”true”][flexi-form-tag type=”submit” name=”submit” value=”Submit Now”] [/flexi-form]


Tagged: Bitcoin, Buy Bitcoin, crypto blog, Crypto news, Should I Buy Bitcoin, should I buy cryptocurrency, why are crypto prices down, why is Bitcoin price down, why is crypto falling