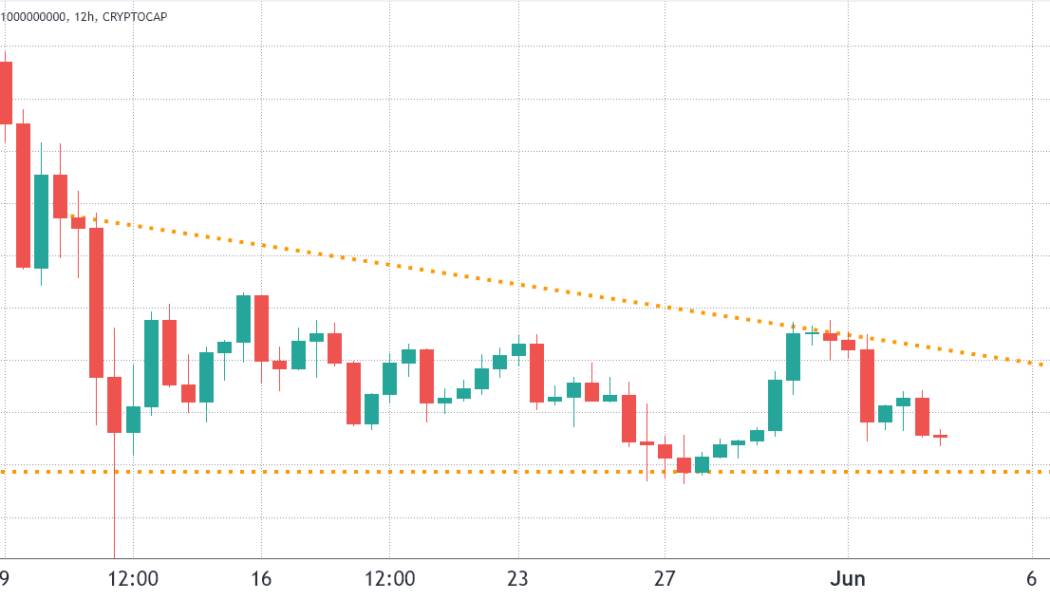
The total crypto market capitalization has ranged from $1.19 trillion to $1.36 trillion for the past 23 days, which is a relatively tight 13% range. During the same time, Bitcoin’s (BTC) 3.5% and Ether’s (ETH) 1.6% gains for the week are far from encouraging.
To date, the total crypto market is down 43% in just two months, so investors are unlikely to celebrate even if the descending triangle formation breaks to the upside.

Regulation worries continue to weigh investor sentiment, a prime example being Japan’s swift decision to enforce new laws after the Terra USD (UST) — now known as TerraUSD Classic (USTC) — collapse. On June 3, Japan’s parliament passed a bill to limit stablecoin issuing to licensed banks, registered money transfer agents and trust companies.
A few mid-cap altcoins rallied, but overall sentiment was unaffected
The bearish sentiment was clearly reflected in crypto markets as the Fear and Greed Index, a data-driven sentiment gauge, hit 10/100 on June 3. The indicator has been below 20 since May 8, as the total crypto capitalization lost the $1.7 trillion level to reach the lowest level since January 27.

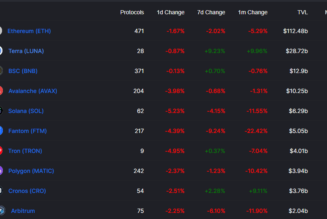
Below are the winners and losers from the past seven days. While the two leading cryptocurrencies presented modest gains, a handful of mid-capitalization altcoins rallied 13% or higher.

Waves rallied 109% after liquidity was brought back to Vires Finance and the Neutrino Protocol USDN stablecoin re-established its $1.00 peg after a $1,000 daily withdrawal limit was imposed on USDT and USDC.
Cardano (ADA) gained 19% as investors expect the “Vasil” hard fork scheduled for June 29 to improve scalability and smart contract functionality, incentivizing deposits to the long-hyped decentralized finance applications on the network.
Stellar (XLM) hiked 18.6% after the remittance giant MoneyGram partnered with the Stellar Development Foundation, launching a service that allows its users to send and convert stablecoins into fiat currencies.
Solana (SOL) lost 8% due to an unexpected block production halt on June 1, requiring validators to coordinate another mainnet restart after four hours of outage. The persistent issue has negatively impacted the network on seven occasions over the past 12 months.
Data points to further price pressure
The OKX Tether (USDT) premium is a good gauge of China-based retail crypto trader demand. It measures the difference between China-based peer-to-peer (P2P) trades and the United States dollar.
Excessive buying demand tends to pressure the indicator above fair value at 100% and during bearish markets, Tether’s market offer is flooded and causes a 4% or higher discount.

Tether has been trading at a 2% or higher discount in Asian peer-to-peer markets since May 30. However, the indicator showed a modest deterioration as it bottomed at a 4% discount on June 1. This data leaves no doubt that retail traders were caught off-guard as the total crypto capitalization failed to break the $1.3 trillion resistance.
Perpetual contracts, also known as inverse swaps, have an embedded rate that is usually charged every eight hours. Exchanges use this fee to avoid exchange risk imbalances.
A positive funding rate indicates that longs (buyers) demand more leverage. However, the opposite situation occurs when shorts (sellers) require additional leverage, causing the funding rate to turn negative.

Perpetual contracts reflected mixed sentiment as Bitcoin and Ethereum held a slightly positive (bullish) funding rate, but altcoin rates were opposite. Solana’s negative 0.20% weekly rate equals 0.8% per month, which is not a huge concern for most derivatives traders.
According to derivatives and trading indicators, the market is at risk of seeing more downside. Evidence of this can be seen in the slightly higher demand for bearish positions on altcoins and the evident lack of buying appetite from Asia-based retail markets.
Bulls need to display strength and hold the $1.19 trillion market capitalization support to avoid an increase in leveraged sellers, bearish bets and the subsequent negative price pressure.
The views and opinions expressed here are solely those of the author and do not necessarily reflect the views of Cointelegraph. Every investment and trading move involves risk. You should conduct your own research when making a decision.
 [flexi-common-toolbar] [flexi-form class=”flexi_form_style” title=”Submit to Flexi” name=”my_form” ajax=”true”][flexi-form-tag type=”post_title” class=”fl-input” title=”Title” value=”” required=”true”][flexi-form-tag type=”category” title=”Select category”][flexi-form-tag type=”tag” title=”Insert tag”][flexi-form-tag type=”article” class=”fl-textarea” title=”Description” ][flexi-form-tag type=”file” title=”Select file” required=”true”][flexi-form-tag type=”submit” name=”submit” value=”Submit Now”] [/flexi-form]


Tagged: Cardano, crypto blog, Crypto news, Derivatives, Futures, Markets, OKX, Solana, Stellas, Tether, Vires, Waves