The cryptocurrency market didn’t perform too well last week but has started this new week in a positive fashion
Last week, the crypto market was a sea of red, with most cryptocurrencies losing more than 10% of their value during that period. However, the market has started the week more positively, and prices are slowly recovering.
Bitcoin is up by nearly 5% over the past 24 hours and is slowly heading towards the $45,000 region. Ether is the biggest gainer amongst the top ten cryptocurrencies by market cap. It is up by more than 10% over the past 24 hours and is trading above $3,100 per coin. Binance Coin (BNB), Solana (SOL), XRP, Polkadot (DOT) and Dogecoin (DOGE) are all trading in the green zone as well.
Zcash (ZEC) is also recovering from recent losses. The cryptocurrency is up by nearly 2% and is trading above $110. It can rally higher if the current market trend is maintained. The market’s short-term outlook remains unpredictable, but market analysts are optimistic about the medium and long-term performance.
Zcash price outlook
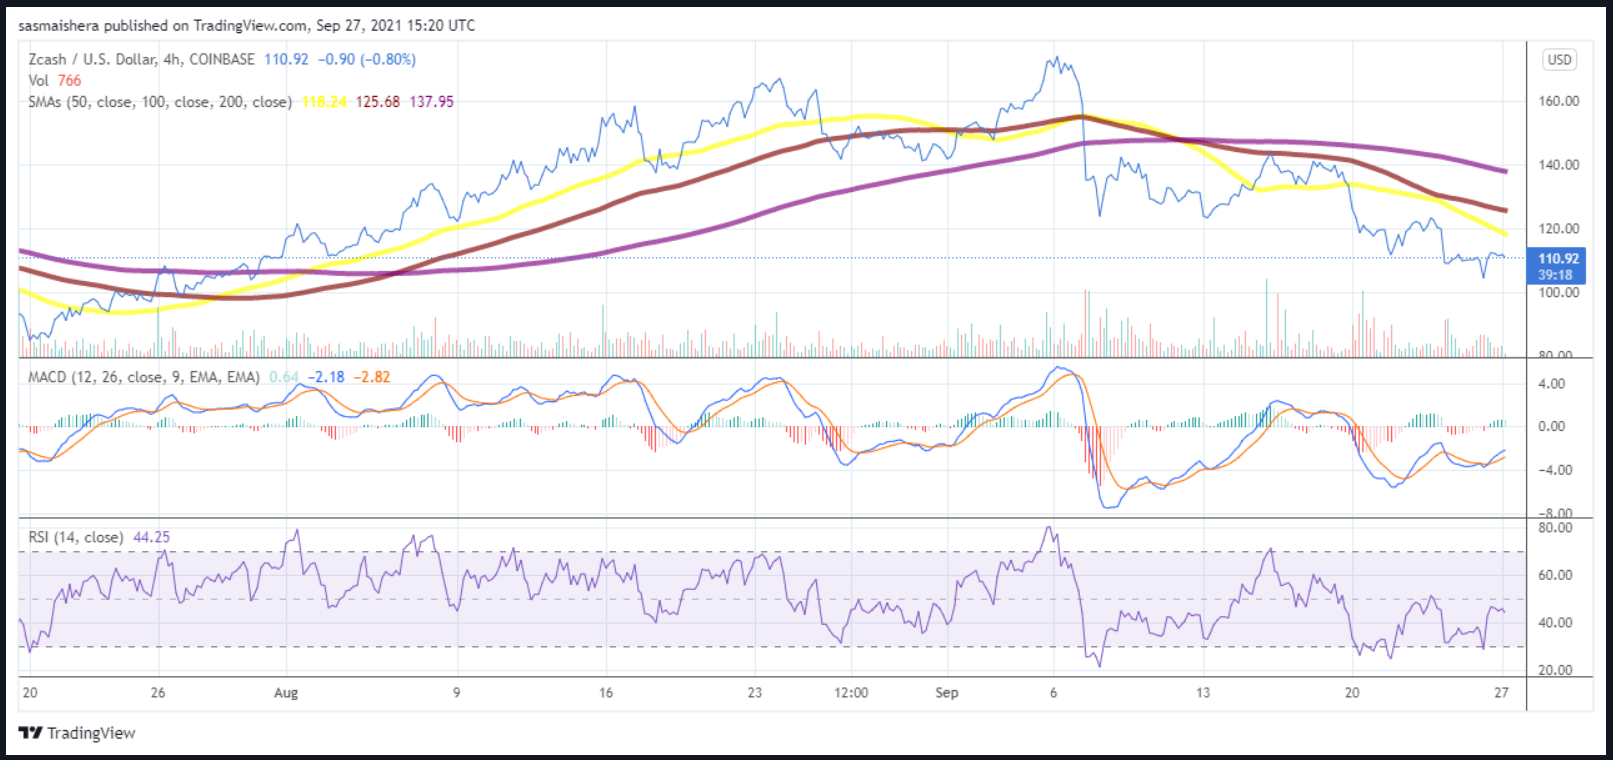
The ZEC/USD 4-hour chart remains bearish as the cryptocurrency hasn’t shaken off its recent poor performance. However, its technical indicators are improving. The MACD line is heading towards bullish territory while its relative strength index (RSI) is improving and is currently at 44.
If the bulls push harder over the next few hours, ZEC could test the first major resistance point at $118, which is also its 50 simple moving average. However, it needs to move past the $114 pivot to reach that resistance level.

ZEC/USD 4-hour chart. Source: Trading View
ZEC’s price can go higher if it gets help from the broader cryptocurrency market over the next few hours. ZEC could target the next resistance point at $130 if current market conditions persist.
However, ZEC’s chart shows it is still bearish, and the bears might still regain control of the market. If that happens, then ZEC could drop towards the first major support level at $105. An extended bearish period could see ZEC drop below the $100 mark for the first time since August.


