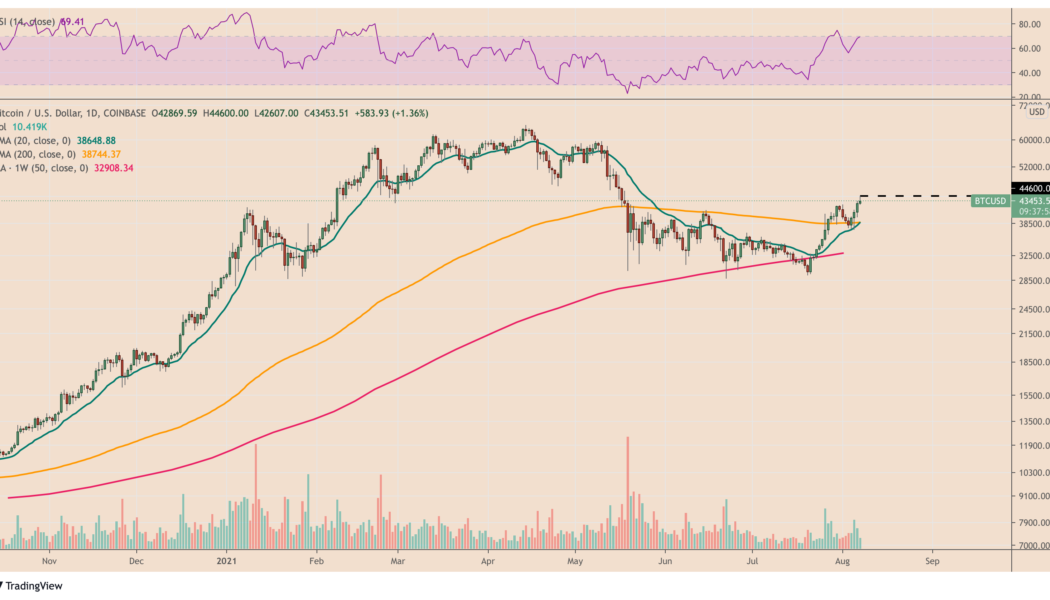
Bitcoin (BTC) price reacted as high as $44,600 on Aug. 7, the highest level since before the infamous May 19 crash. Meanwhile, there are increasing speculations that BTC could undergo a similar upside boom like the one that began in October 2020.

At least two indicators expected Bitcoin to pursue massive uptrends. The first one was Glassnode’s Entry-Adjusted Net Unrealized Profit/Loss that assists investors in determining whether the Bitcoin network as a whole is currently in a state of profit or loss.
Understanding NUPL and its heat map
A NUPL reading above zero indicates that the network is in a state of net profit, while values below zero indicate a state of net loss. The further NUPL deviates from zero, the more it helps investors spot market tops and bottoms.
They spot the degree of deviations from zero via a heat map. For example, during an uptrend, red indicates “capitulation,” orange means “hope,” yellow shows “optimism,” green hints “belief,” and blue underscores “euphoria.”
In October 2020, the Bitcoin NUPL moved upward of zero as its heat map changed colors from yellow to green after successfully bouncing off the red zone in March earlier that year.
Later, the prices moved from approximately $10,000 to around $65,000.

Bitcoin dropped later to below $30,000, a period that saw its NUPL mood switching from greed to denial and later to anxiety. But a strong buying sentiment near the $30,000 level helped sustain Bitcoin’s upside sentiment intact, offsetting anxiety with optimism.
But just as Bitcoin reclaimed $40,000 and exceeded its upside momentum, the sentiment switched back to belief for the first time since October 2020. Lex Moskovski, Chief Investment Officer at Moskovski Capital, also highlighted Bitcoin’s upside prospects following the NUPL upgrade in a tweet, saying:
“We’ve entered the Belief phase.”
Alternatively, the popular Fear and Greed Index also touched 69, a score that indicates a sentiment of Greed, which the market also hasn’t seen since May.

The second indicator
On a similar note, market analyst Will Clemente also highlighted another indicator that promised to repeat October 2020’s upside boom. The fractal concerned the dynamic between short and long-term Bitcoin holders.
Clemente noted that short-term holders sold off their Bitcoin holdings to long-term holders, insomuch that the former accumulated almost as much as the Bitcoin supply in August 2021 that they had back in October 2020.
Related: Ethereum price soars above $3K into ‘red zone’ triggering sell-off fears
“Long-term holders now have over 66% of supply, short-term is now down to nearly 20%,” the analyst wrote. “Before the main bull run began in October, long-term holder supply reached just over 68%.”

That further indicated that the latest price appeared out of the demand from investors that had no intentions of selling Bitcoin immediately.
Bitcoin achieved an intraday high of $44,600 on Saturday before correcting lower due to profit-taking sentiment. BTC was changing hands for $43,500 at the time of writing.
The views and opinions expressed here are solely those of the author and do not necessarily reflect the views of Cointelegraph.com. Every investment and trading move involves risk, you should conduct your own research when making a decision.


